Showing posts with label evacuation. Show all posts

Tuesday, October 13, 2015

Thoughts On The Post-Pilgrim Nuclear Power Plant Future


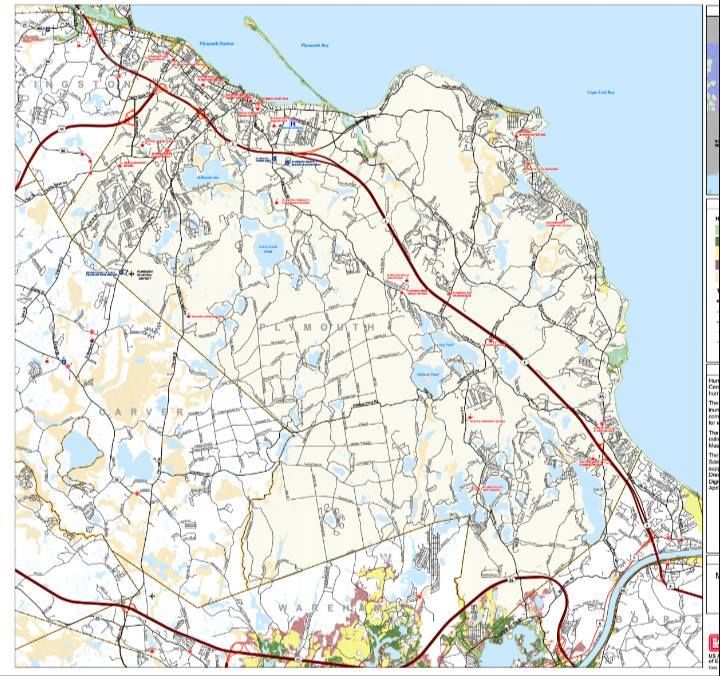
The Pilgrim Nuclear Power Station in Plymouth will close in 2019, according to multiple sources.

They are citing low energy costs, market pressures and millions of dollars in necessary upgrades as the reasons for the closure.

The power plant was a source of both energy and concern for area residents ever since it was placed in the Manomet scrub coast. It helped keep the houses warm and the drinks cold for a few decades, and- Good Lord willing- we got it opened and closed without a Chernobyl-style disaster.

I took a tour of Pilgrm in 2008 or so, for an old article that I cant find in the archives. It looked very 1970s, with multiple dial labeled controls that made me think of the Batcave from the 1960s version of the Batman show. That's really what it looked like, sans Bat-mobile of course.

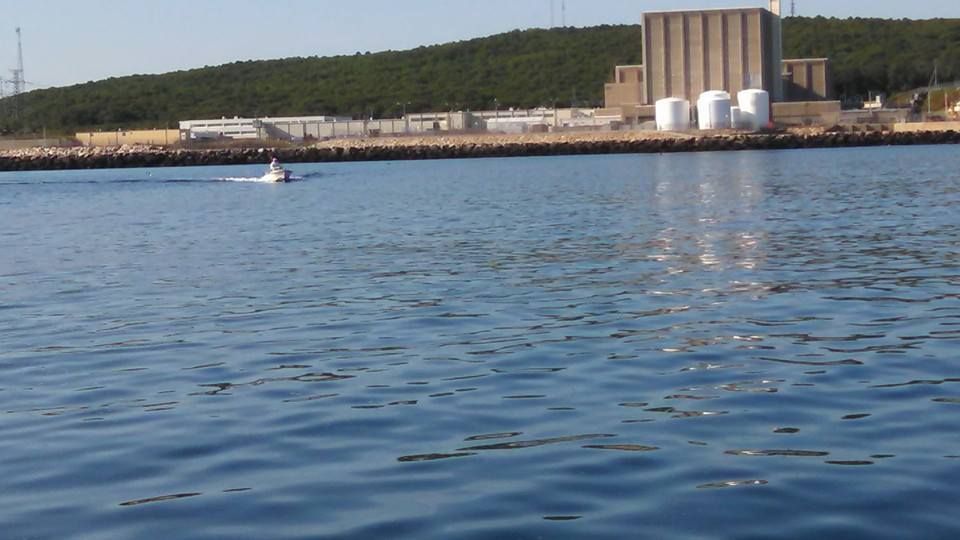
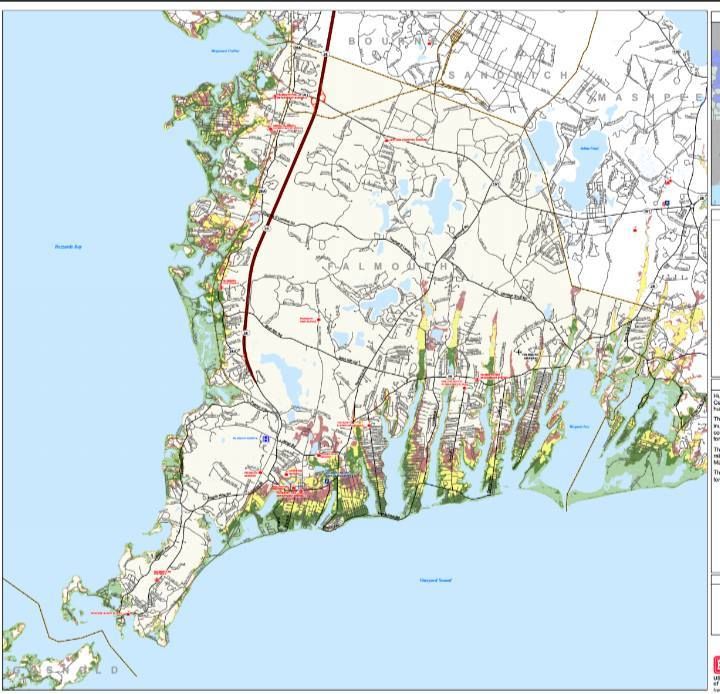
A few other things jumped out at me. The plant, while listed at 27 feet or so, seemed to be very, very close to sea level. They had two jetties and a jersey barrier between the Atlantic Ocean and a boiling water nuclear reactor.

The water flowing out of the plant, towards the ocean, was exactly the same color as Mountain Dew. I'm sure this has to do with sunlight and ionized water or something, and that nuclear power doesn't turn you green like the Incredible Hulk, but still...

The plant was also storing spent fuel on the site, hoping to send it to the Yucca Mountains in Nevada or somewhere like that. Amazingly, there aren't many takers when you're shopping Spent Nuclear Fuel storage.

The plant was also heavily, heavily guarded. I won't spill their details or anything, but you'd want to have a very good plan if you wanted to do some Bond Villain stuff. You'd be getting lit up before you even got exposed to the uranium or whatever they were using there.

The security force, which is 101% paramilitary, even wear their assault rifles while eating Chinese food. I kid you not. The guy I saw doing that immediately became my permanent visual definition of Badass Casual. You know he's gonna shoot you more than necessary if your terrorist attack makes him have to dump his General Tso's chicken on the ground and sling up Ol' Painless.

You can read about the shutdown here, or about the plant itself here... I'm not the expert. I'm more of the write-a-thought-provoking-article guy.

Here are some tangents we can explore together, if you like....

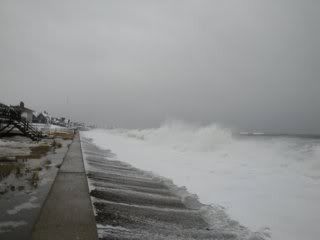
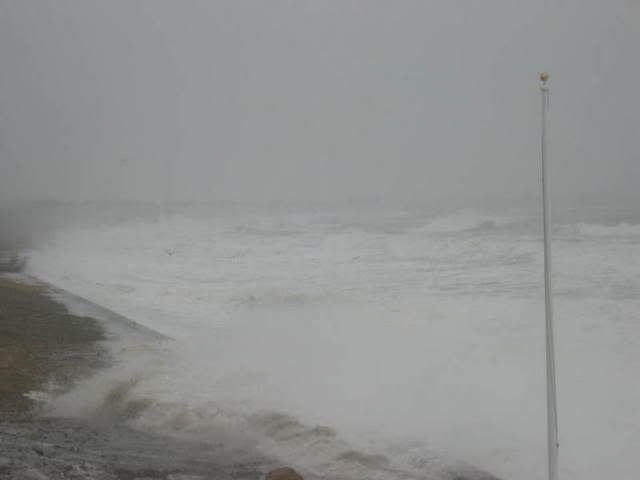
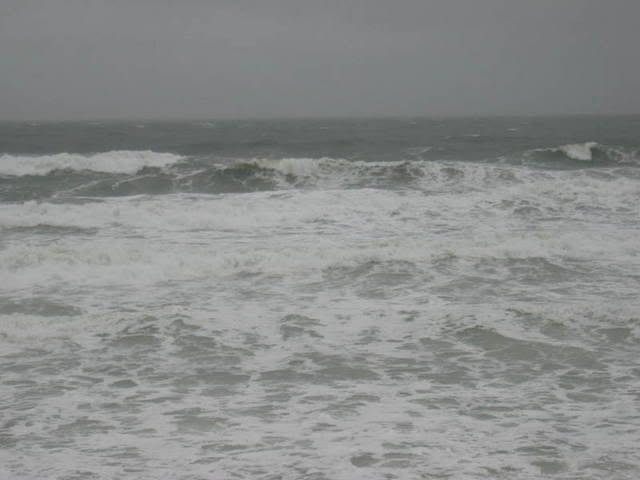
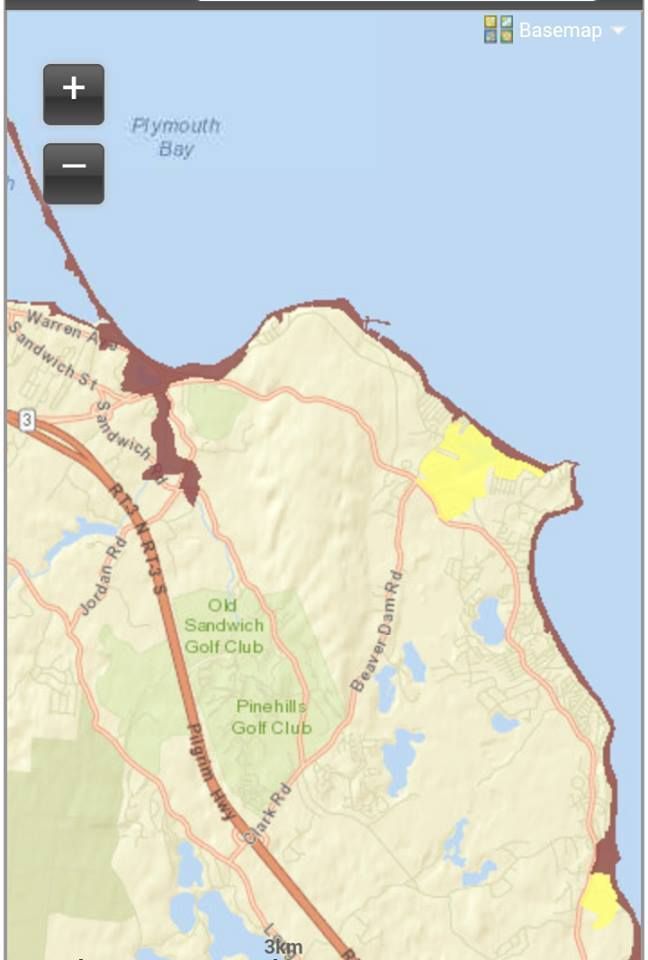
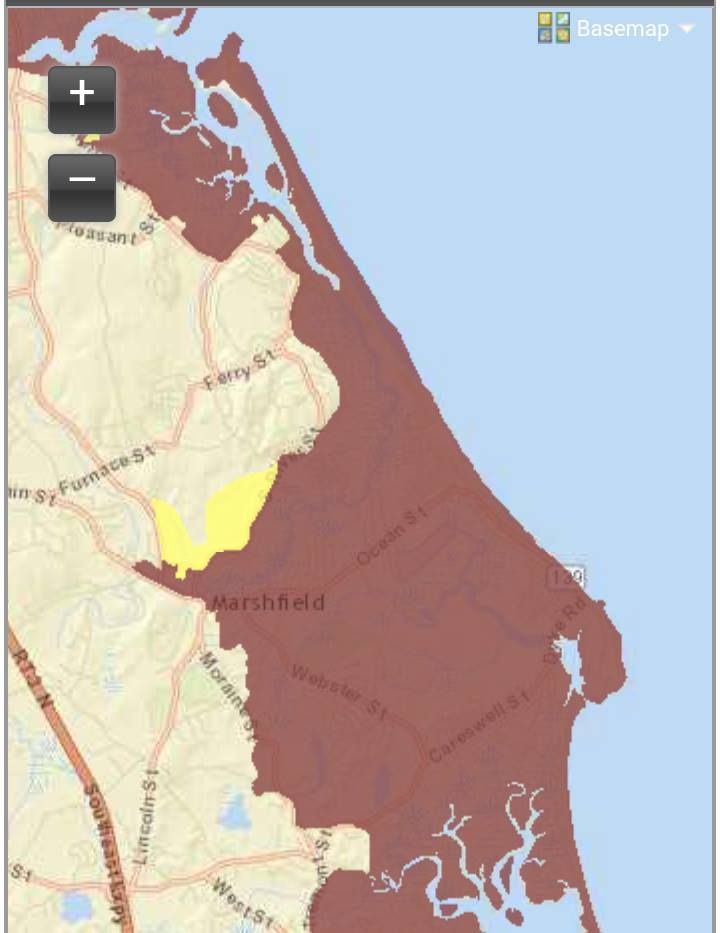
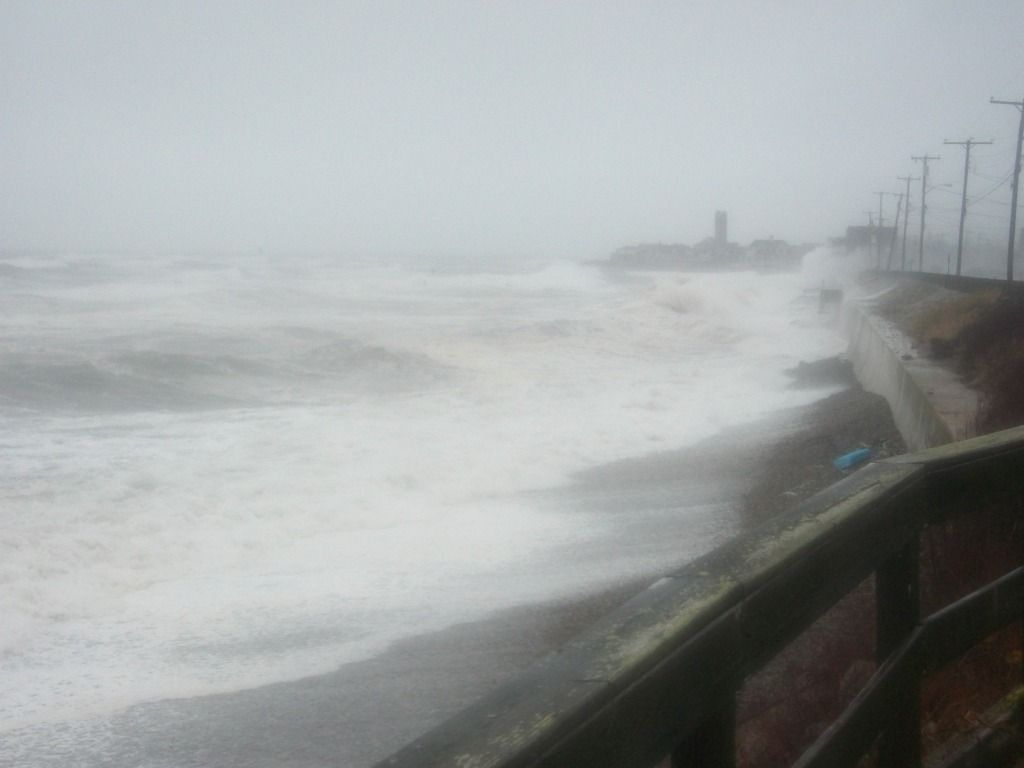
- Unless something bad happens quickly, we will never know if Pilgrim would have been able to stand up to a direct-hit monster hurricane. It had a nice bit of elevation, built on top of a sizable sand cliff. It also had Cape Cod blocking anything but a direct-hit storm.

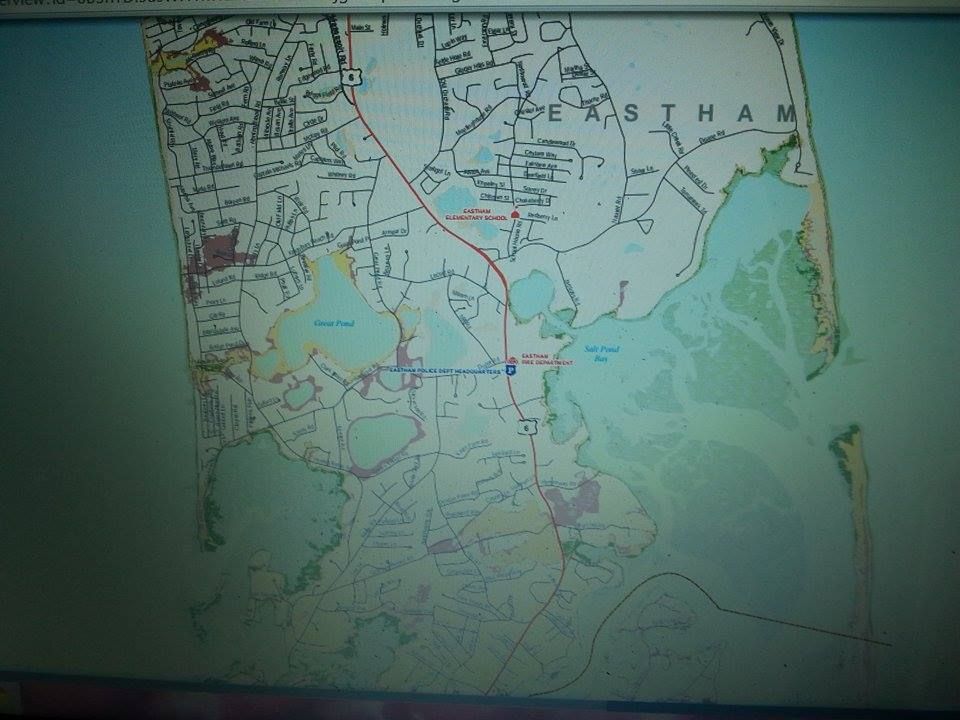
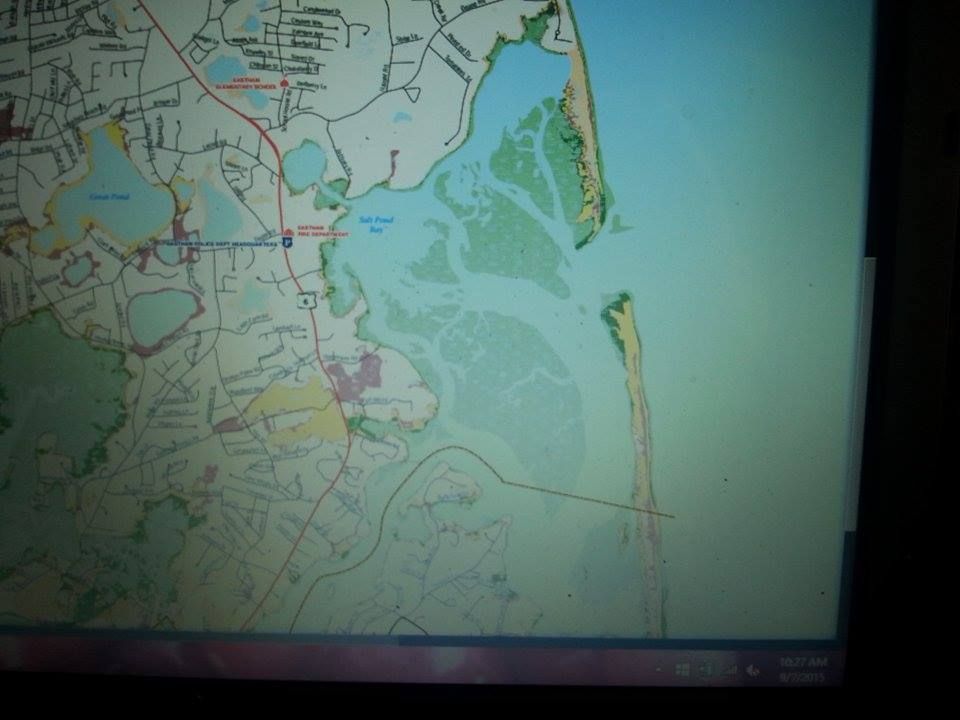
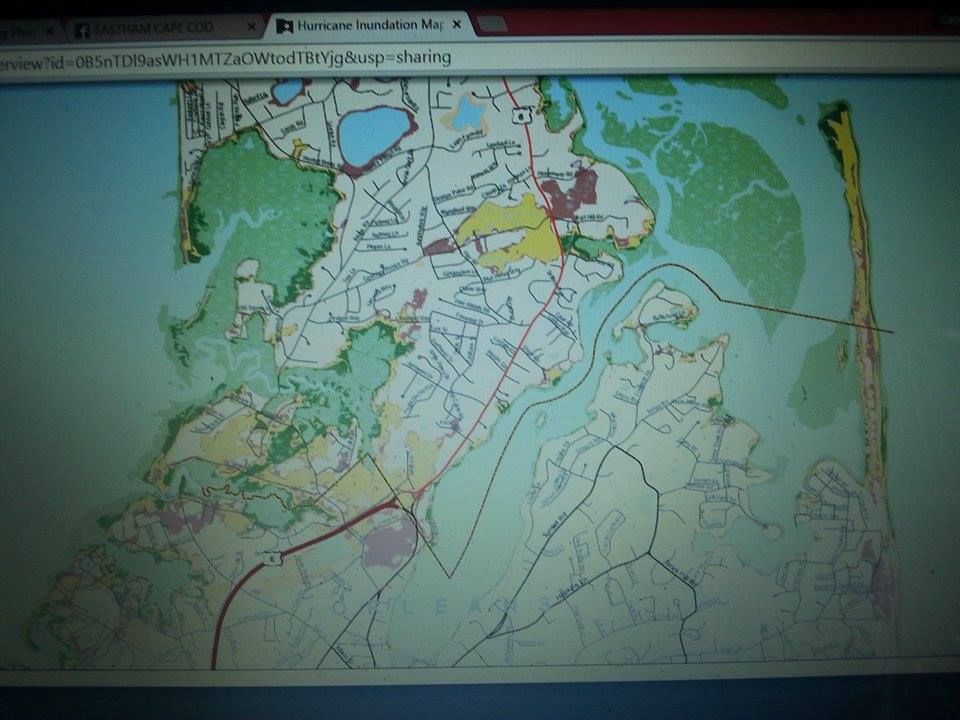
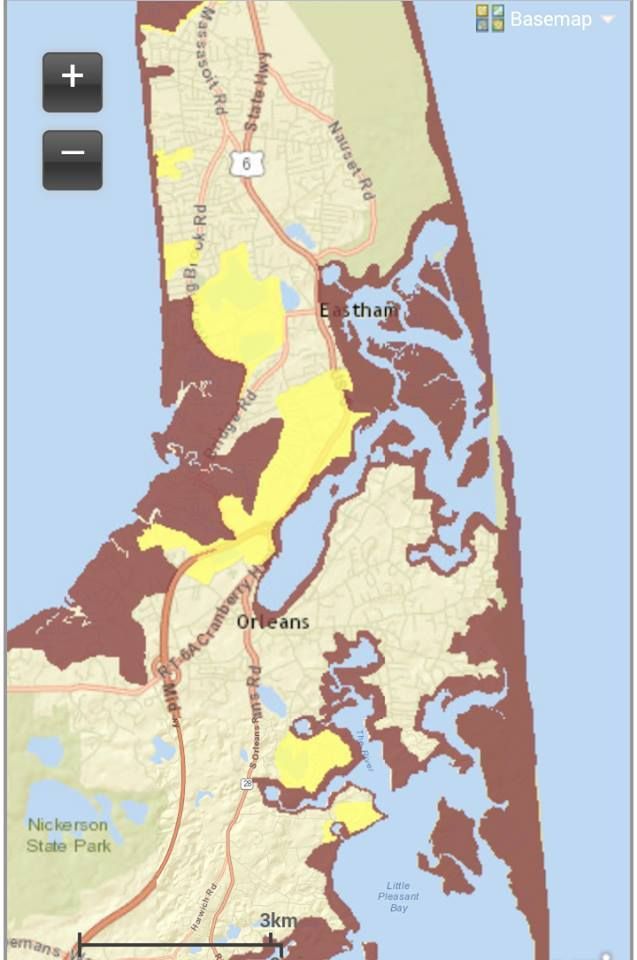
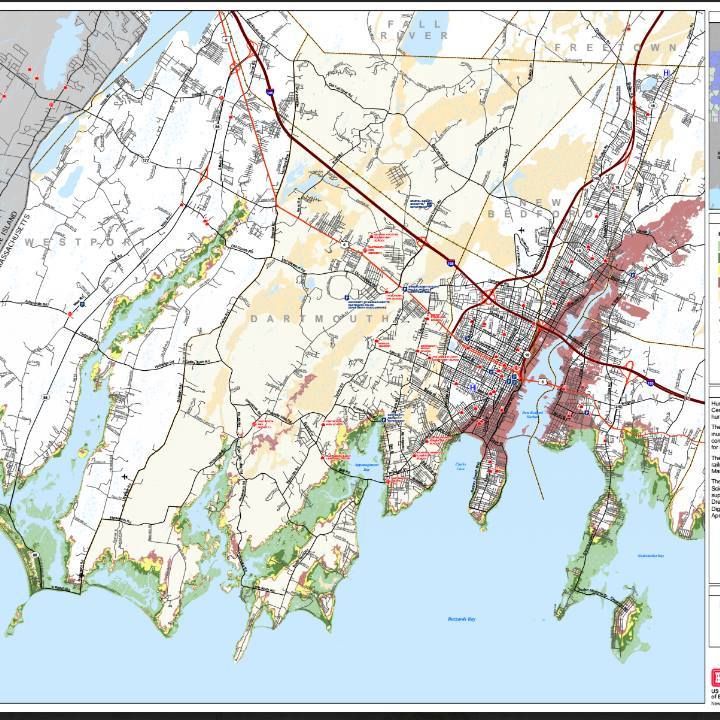
Someone should put a marker about where the Fukushima line of reactor inundation would be, and maybe someday we'll see if the planners made a few crucial planning errors.

- If you wonder what the sudden loss of 14% of Massachusetts' power generation will do to your power bill, you'll find out in July of 2019. Remember, Cape Wind also got the Bozack from just about everyone, so we won't even have nascent wind technology to help things along.

- The plant's closure will cost the town 600 nice-paying jobs and $9.75 million a year in taxes. It also means we will need to import an additional 10 million barrels of oil and run our coal-fired power plant in Sagamore much harder.

- I'm already seeing a lot of "News Flash: Plymouth Economy To Collapse In 2019" things on Facebook. I'm seeing sympathy for the plant workers, too.

- I wonder what the NO ESCAPE FROM THE CAPE people who we used to see on the Sagamore Bridge will do for fun now.

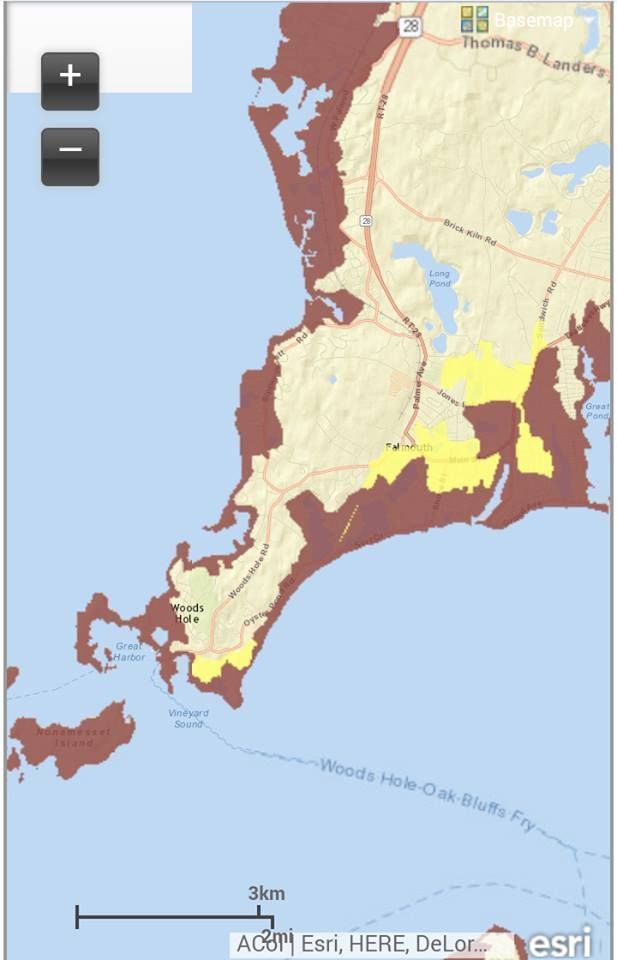
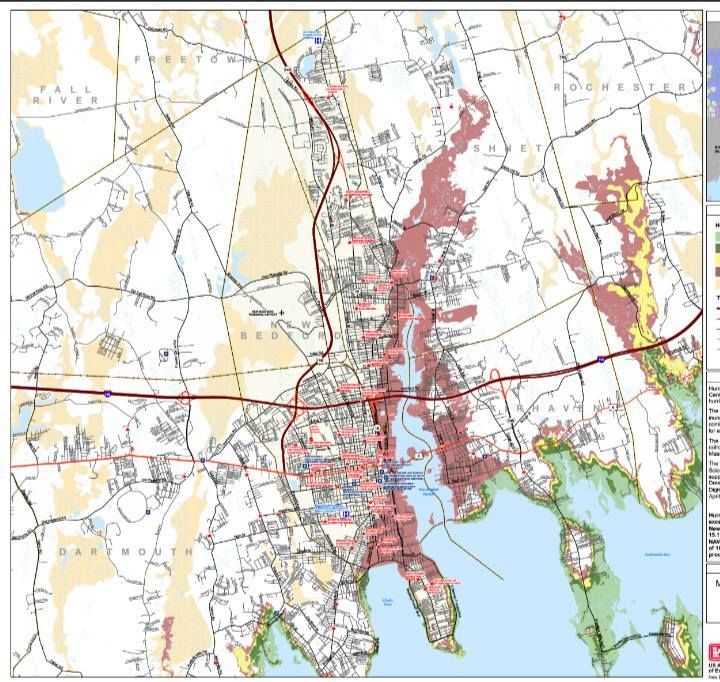
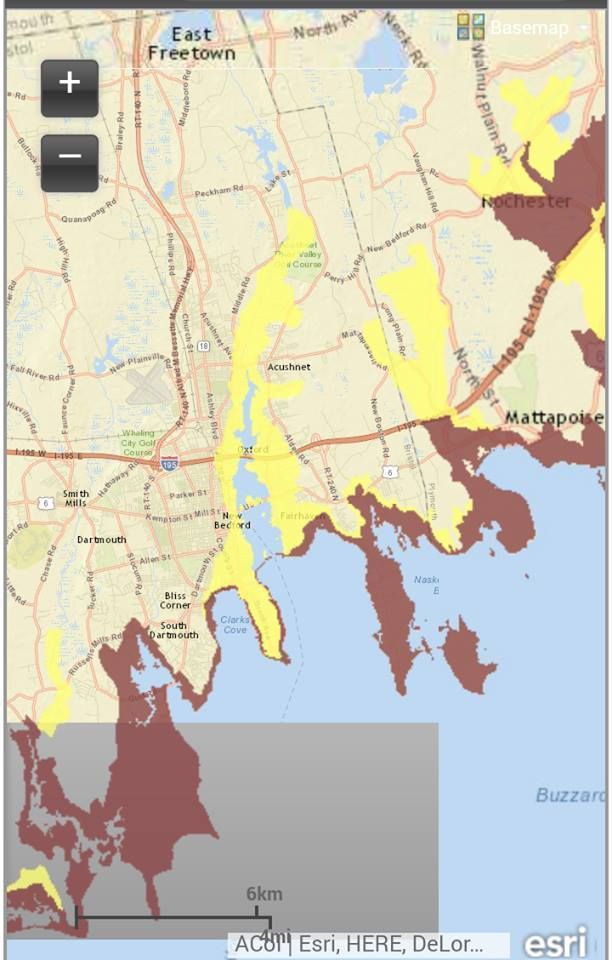
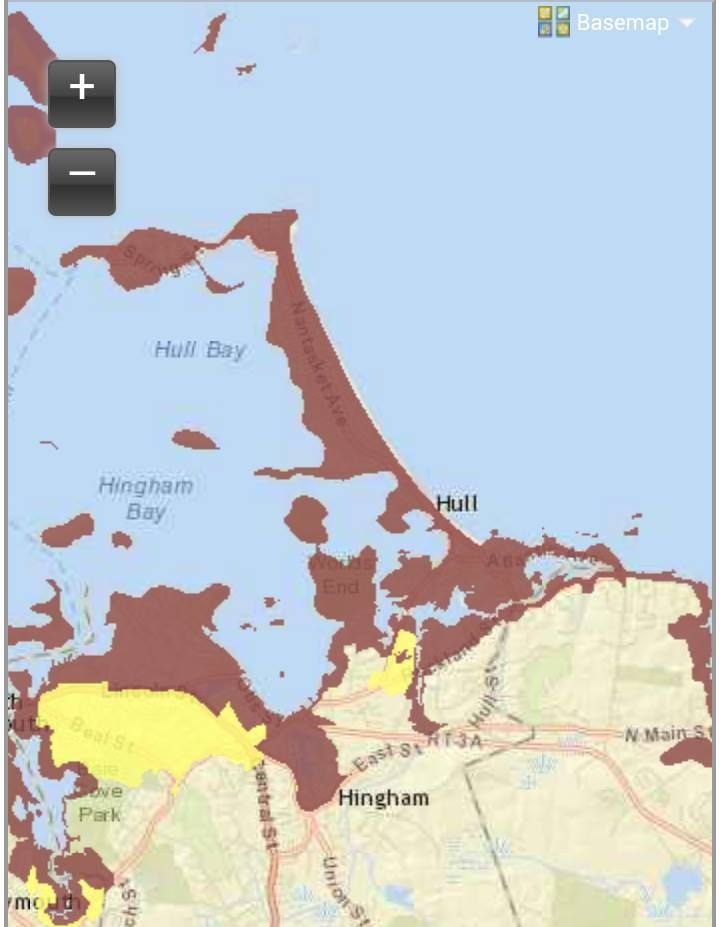
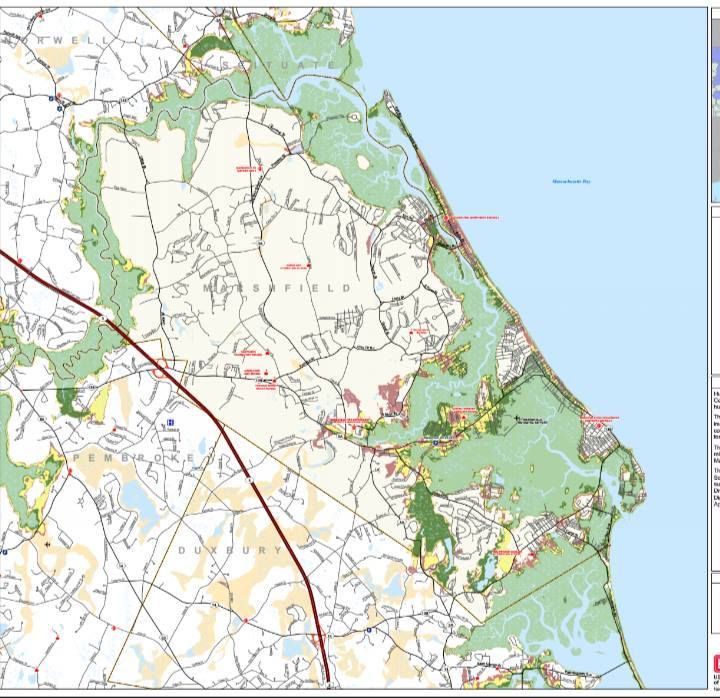
- The closure of the plant means that Monster Hurricane becomes the only way we'll see a massive evacuation of Cape Cod, short of an Atlantic tsunami or the sudden arrival of Godzilla. We were looking at a Road To Basra type scenario of people cooking in their cars with a nuclear accident causing Cape Cod to empty.

- I planned to evacuate by boat, with the fact that I don't own a boat just being a minor obstacle in my world view.

- I'll have to go into the archives, find my Cape Cod Disaster Scenarios article, and revise the list from the top down. Pilgrim had the top spot there, I forget what #2 was, it may have been "series of shark attacks destroys tourist economy" or "asteroid strike" or "Sea AIDS."

- No, I don't know how long it will take to dismantle it, or how long before the area is safe for farming or anything like that. The line starts on the right for the Grown On The Site Of The Former Nuclear Power Plant produce.

- Will the towns keep the nuclear air-raid sirens up, on the off-chance we get a tornado or an air raid or something? We could have town-wide versions of the Morning Announcements we all remember from high school. I'd like Duxbury to use theirs to constantly broadcast reggae instrumental beats.

- Much of the area around Pilgrim, and I mean like Manomet to Bournehurst, is wildly underdeveloped scrub forest. If they start filling that in, we may need to carve a piece off of southern Plymouth and make a new town, maybe merging it with mainland Bourne. We'll do a whole article on that once some of the more serious people straighten me out on it in the comments or on Facebook.

- Will there be reluctance to develop that land around the plant? Will we have a Forbidden Zone?

- Would developing the Forbidden Zone around Pilgrim generate enough property taxes and carpenter jobs to offset the tax hit and plant job loss?

- It'd be funny if the land where Pilgrim presently stands is developed, someone puts a corny seafood restaurant there, Al Qaeda fails to get a series of memos, and a sorely-mistaken terrorist crashes a SEMTEX-loaded Cessna into a Seafood Shanty-type clam shack. Hopefully, it happens off-season.

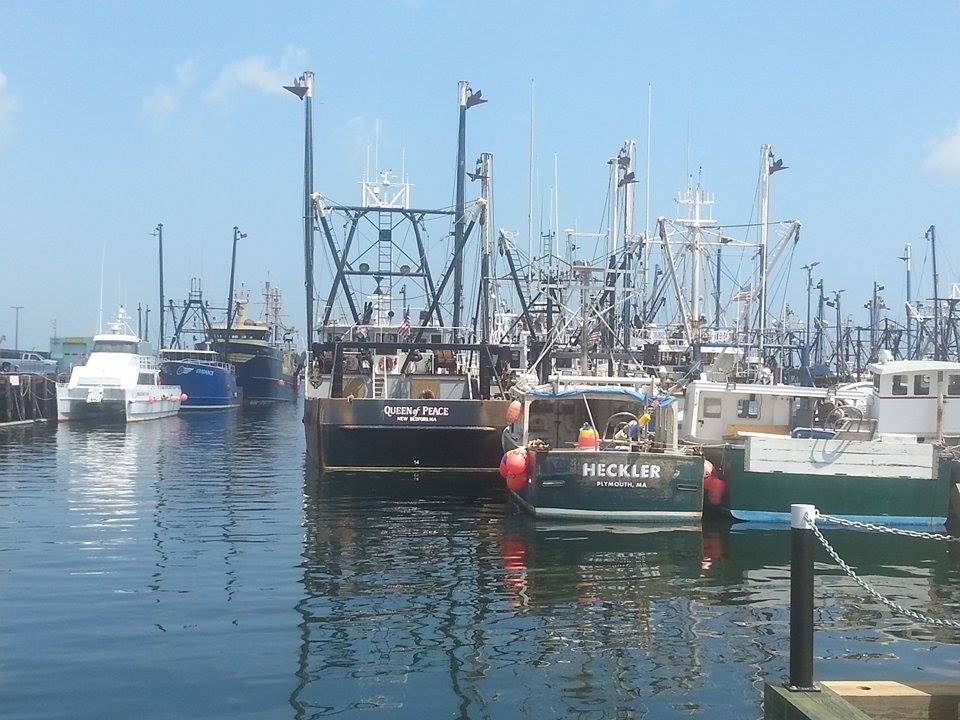
- Fearless fishermen knew that the fishing was always good off Pilgrim. The water temperature differential plays a role or something, I don't know. It's always an Act Of Luck whenever I catch a fish.

- This pretty much kills the Cape Cod setting for my Nuclear Mutant Shark  movie script. I'm never gonna get that Oscar now...


Tuesday, September 29, 2015

Harwich Hurricane Planner


We have two maps from FEMA to check out today. The map above is a Hurricane Inundation map, and it depicts storm surge from a direct hit hurricane visiting Harwich at mean high tide. It also shows what sort of storm would be needed to soak certain regions, which we'll get to in a minute.

The map is from the combined efforts of FEMA, MEMA, NOAA and the NHC. They use the funny-weatherman-titled SLOSH model of storm surge estimation. They do not depict freshwater flooding.

The colors relate to the Saffir-Simpson scale of hurricane intensity, and break down like this:

Light Green = Category 1 hurricane. Hurricane Gloria was one of these, and the offshore Halloween Gale was, too. Although not a tropical system, the Blizzard of '78 did Cat. 1-style damage.

Dark Green = Category 2 hurricane. Hurricane Bob was one of these.

Yellow = Category 3 hurricane. We've only had five of these hit New England since the Other Man arrived in 1620, the most recent being Hurricane Carol in 1954.

Pink = Category 4 hurricane. We've had one in recorded New England history, and it struck in 1635.

Flesh = One Hundred Year FEMA Food Zone. This is the "100 year storm" you hear people speak of, but you have to go pre-Colombian to find them ("going pre-Colombian" means using salt marsh soil samples to look for sand layering associated with large hurricanes). New England has had storms in the Category 4+ level in the 1100s, the 1300s, and the 1400s.

Sorry about Flesh, but my knowledge of color names was and continues to be heavily influenced by whoever was in charge at Crayola in the 1970s.

We shall leave the street-by-street analysis to the reader, who can use the links I'll throw in at the end of the article to zoom in on their own house if it suits them.

Note that you don't need to be in a shaded area to get yourself a quick and sudden Ending. You can have a tree fall on you, have your car washed out in street flooding, step on a downed power line, get purged by looters, enjoy the Robespierre treatment from flying shingles, be summarily executed by National Guardsmen, or even stumble into a sharknado. There's no shortage of ways for you to get Left.

With that in mind, we now present to you the down-there-somewhere Evacuation Zone map.

Remember, you don't HAVE to leave when 5-0 tells you to. Also remember that the cop you read the Constitution to before the storm may be the one who has to fish you out of the drink when the ship hits the fan.

The E-map is easier to read, as it is made up of only two colors.

Red = Get Out.

Yellow = Get the f*** out.


Hurricane Inundation Maps

Evacuation Maps

Worst Hurricanes To Hit New England

List of all hurricanes to hit New England

Monday, September 21, 2015

Chatham Hurricane Special


Chatham is, if you view Cape Cod as a big fist being shaken towards Europe, the Elbow. Like any other elbow, it's gonna get banged off things now and then. In this case, instead of a table, its a Hurricane.

There are no imminent storms, Chatham is just next up to bat in our ongoing series.

We have two maps from FEMA to check out today. The map above is a Hurricane Inundation map, and it depicts storm surge from a direct hit hurricane visiting Chatham at mean high tide. It also shows what sort of storm would be needed to soak certain regions, which we'll get to in a minute.

The map is from the combined efforts of FEMA, MEMA, NOAA and the NHC. They use the funny-weatherman-titled SLOSH model of storm surge estimation. They do not depict freshwater flooding.

The colors relate to the Saffir-Simpson scale of hurricane intensity, and break down like this:

Light Green = Category 1 hurricane. Hurricane Gloria was one of these, and the offshore Halloween Gale was, too. Although not a tropical system, the Blizzard of '78 did Cat. 1-style damage.

Dark Green = Category 2 hurricane. Hurricane Bob was one of these.

Yellow = Category 3 hurricane. We've only had five of these hit New England since the Other Man arrived in 1620, the most recent being Hurricane Carol in 1954.

Pink = Category 4 hurricane. We've had one in recorded New England history, and it struck in 1635.

Flesh = One Hundred Year FEMA Food Zone. This is the "100 year storm" you hear people speak of, but you have to go pre-Colombian to find them ("going pre-Colombian" means using salt marsh soil samples to look for sand layering associated with large hurricanes). New England has had storms in the Category 4+ level in the 1100s, the 1300s, and the 1400s.

Sorry about Flesh, but my knowledge of color names was and continues to be heavily influenced by whoever was in charge at Crayola in the 1970s.

Zoomed out... blurry, but anything unshaded is flooded....
We shall leave the street-by-street analysis to the reader, who can use the links I'll throw in at the end of the article to zoom in on their own house if it suits them.

Note that you don't need to be in a shaded area to get yourself a quick and sudden Ending. You can have a tree fall on you, have your car washed out in street flooding, step on a downed power line, get purged by looters, enjoy the Robespierre treatment from flying shingles, be summarily executed by National Guardsmen, or even stumble into a sharknado. There's no shortage of ways for you to get Left.

With that in mind, we now present to you the down-there-somewhere Evacuation Zone map.

Remember, you don't HAVE to leave when 5-0 tells you to. Also remember that the cop you read the Constitution to before the storm may be the one who has to fish you out of the drink when the ship hits the fan.

The E-map is easier to read, as it is made up of only two colors.

Red = Get Out.

Yellow = Get the f*** out.


Hurricane Inundation Maps

Evacuation Maps

Worst Hurricanes To Hit New England

List of all hurricanes to hit New England


Thursday, September 17, 2015

Falmouth Hurricane Information Special


Falmouth holds a corner lot on Cape Cod, facing both Buzzards Bay and Nantucket Sound. You never want to have multiple county-sized bodies of water looking to push ashore into your town when a storm comes, which leads us to today's topic of discussion.

We have two maps for you to analyze with your friends and family. The map above is a Hurricane Inundation Map. It comes from FEMA, MEMA, NOAA and NHC, will be written about by ME, and read by U.

"Inundation" is a fancy word for "storm surge," which are two fancy words for "water pushed ashore by a storm." This is the killer in a storm, it's what did in New Orleans 10 years ago, and the maps give you several views of it.

You can see where water will come ashore in a direct hit hurricane arriving at high tide, and you'll see what degree of storm (via the Saffir-Simpson hurricane intensity scale) will flood different parts of town. They are based on the zany-weatherman-titled SLOSH model of storm surge inundation.

These maps do not project freshwater flooding things like rain, overflowing rivers and sewer backups, as well as people just spraying the hose into the street for the hell of it, mid-storm, because Falmouth is a hardcore sort of town.


Light Green = Category 1 hurricane. The Blizzard of '78 and the Halloween Gale are good examples of Category 1 storm damage, although neither was directly a hurricane. If those didn't hit hard down there (I'm a Duxbury kid, and was on Duxbury Beach for '78 and '91), use Hurricane Gloria as a hits-at-low-tide benchmark.

Dark Green = Category 2 hurricane. Hurricane Bob was a weak Category 2, and yes we do realize that "weak" and "Category 2 hurricane" are odd words to chain together.

Yellow = Category 3 hurricane. We've only had five storms of this strength hit New England since the Other Man arrived in 1620, the most recent being Carol in 1954.

Pink = Category 4 hurricane. We've had one in recorded history, in 1635.

Flesh = 100 Year FEMA Flood Zone. This is the "hundred year storm" you hear about, although you have to go pre-Colombian to find them. New England was hit by storms greater than Category 4 in roughly 1100 AD, 1300 AD and 1400 AD. They can tell by checking layers of sand on salt marsh muck.

Sorry about "flesh," my knowledge of colors was greatly dictated by the people at Crayola in the 1970s.


You can check these maps in far greater detail by going here and zooming a bit. It's disaster porn, styled to your very home!

Again, these maps do not depict freshwater flooding, and freshwater flooding will cause a whole slew of problems on her own if a hurricane says "Wuzzup?" to Wood's Hole.

Remember, you don't have to get flooded with seawater to die in a hurricane. You can get hit by lightning, sucked into a river, mashed in a road accident, have a tree fall on you, step on power lines, stumble into a sharknado or be killed by looters.

These maps show you what dangers face your particular house, and you can use them to decide on whether to make a run for it or not.


We'd also advise you to chat up the oldest guy with the longest residency in your neighborhood. Find out what Carol did to the house you live in now. Find out how high the water was in the street, how long the power was out for, what roads become impassable, and any other k-nuggets of knowledge the old fella might have.

Cranberry County Magazine stands strong behind our philosophy that your hurricane preparation planning is incomplete until you talk to some white heads. Your neighborhood's Old School is an asset which should not be underutilized.

FEMA and GRAMPS may hold differing opinions as to when you should flee, but FEMA most likely wasn't living on your street in 1954 when Carol came ashore. Gramps was. If he says your street floods and FEMA doesn't (my own neighborhood floods in nor'easters, but FEMA gives it Category 4 status), you may want to do some serious merit-weighing when deciding if you should Get To Steppin'.

This leads to our second map style, the Evacuation Map,

This is the map the authorities use when determining which neighborhoods will be evacuated. You don't HAVE to leave when the police tell you, but you also want to remember that the cop you were reading the Constitution to before the storm might very well be the one who has to make a decision as to whether or not to dive in to the maelstrom after you and your family.

I'm not chastising you. I watched the Halloween Gale from a waterfront home, with the police on a nearby hill blasting a searchlight on us the whole time.

Of course, that was a stupid move, so we'll work the other side now, and tell you about Feets Don't Fail Me Now, Heading For The Hills, and Running Like A Scaled Dog.

This map is easier to follow. It has two colors:

Pink = They have to evacuate.

Yellow = You do, too.

Here's the Evacuation Zone map:


Hurricane Inundation Maps

Evacuation Maps

Worst Hurricanes To Hit New England

List of all hurricanes to hit New England


Wednesday, September 9, 2015

New Bedford Hurricane Special


New Bedford is about as salty as it gets, and they get that salting by being exposed to the ocean, both as a profession and as residents.

This puts them in the path of some potentially serious storms.

New Betty had a 5.8 foot storm surge during Hurricane Bob, and one of her fishing boats off of Cuttyhunk reported a peak gust of 182 mph. NB had wind gusts over 90 mph during Hurricane Gloria, 110 mph during Hurricane Donna, and a 20 foot storm surge from Hurricane Carol.

Yup, you can get messed up pretty smooth in New Bedford, really get your hat handed to you. They also have bad hurricanes.

You have to be ready to deal with the sea if you're even thinking of living in New Bedford. The town does their best, throwing up a hurricane barrier to protect most of the city from anything but the worst hurricanes. You can see it up in the lead photo. It protects the Acushnet River, and, therefore most of New Bedford.

What you see below is a Hurricane Inundation Map for New Bedford. It shows what areas of New Bedford would be flooded in a direct-hit hurricane. The map comes from FEMA, MEMA, NOAA and NHC.

It also shows what strength of hurricane (strength measured by the Safford-Simpson hurricane intensity scale) would be needed to inundate certain areas. It does not depict freshwater flooding.


Light Green = Category 1 hurricane... Hurricane Gloria was a weak Category 1 hurricane. Yes, "weak" and "hurricane." are tough words to use in the same sentence, but this is how we Do.

Dark Green = Category 2 hurricane... Hurricane Bob was a Category 2, and he beat up New Beddy like she stole something while concurrently saying something awful about Bob's mother.

Yellow = Category 3 hurricane... only 5 of these have hit New England since the Other White Meat arrived in 1620, the most recent being Hurricane Carol in 1954.

Pink = Category 4 hurricane... we've only had one in our recorded history, in 1635.

Flesh = 100 Year FEMA Flood Zone. This is the hundred year storm you hear people speaking of, although you have to go pre-Colombian to find some in New England history. They (people who study this stuff) use salt marsh soil analysis techniques to study prehistoric hurricane histories, and New England was hit by storms above Category 3 in the 1100s, 1300s, and 1400s. Only the Native Americans saw them.

I don't have a better Art term for the 100 year storm color than Flesh. Blame whoever was running Crayola in 1973.

Here are a few things of note:

- FEMA and company developed these estimates based on the zany weatherman titled SLOSH model of storm surge inundation.

- I'll leave neighborhood-by-neighborhood analysis to you. I'm from friggin' Duxbury, what do I know?

- Once that hurricane wall goes, things get ugly fast in New Bedford. It's funny when the seawall gets topped over on Duxbury Beach, and 50 rich people have to drive the Land Rover up the hill. It's not so funny when 20 feet of water is rushing at 100,000 poor people.

- Just about anything south of the hurricane barrier faces a serious threat from even minor storms.

- Parts of Route 195 will be under Buzzards Bay in a bad enough storm.

- Clark's Cove didn't get a 20 foot boulder wall to protect her people.... so, uhm, have fun out there, folks.

- Cranberry County Magazine strongly advocates seeking out a local old-timer who was in your neighborhood for a major storm like Hurricane Carol. Find out whatever he/she can tell you about what happened to your neighborhood. The folks from the Old School watched hurricanes hit your neighborhood, and most of the FEMA kids haven't.

- New Bedford lost 2/3 of her fishing fleet in the 1938 hurricane.


With all of this stuff we're kicking around, it might make sense to flee New Beige if a hurricane is coming. Which parts of town will the authorities be evacuating?

The map below is an Evacuation map, and it is what The Man will be using as a template when issuing evacuation orders.

The differing colors are for differing intensities of storms, with Pink meaning "Get Out," and Yellow meaning "Get the **** out, now!"

The hurricane barrier pays off here, as only the areas to either side of it would be evacuating in a milder hurricane. Once the barrier is topped, however, it's every man for himself.

Notice that Route 195 and Route 6 get cut off by seawater in several spots, so plan to be Audi early.

New Bedford doesn't evacuate for just any storm, but when they do evacuate, they evacuate several miles inland.


That's pretty much what we have for you today. You should learn it/know it/live it.

If you disagree with something in here, let me know in the comments section. I had some disagreement with FEMA on my own beach.

Check the maps for yourself:

Hurricane Inundation Maps

Evacuation Maps


Tuesday, September 8, 2015

Come Hull or High Water: One Hull Of A Hurricane Preparation Article

"If I owned Hull and Texas, I would live in Hull and rent out Texas."
Hull sticks way out into the ocean, which is never a good thing in a coastal flooding scenario. It is very low-lying in spots, also a bad. It is also very densely populated, which complicates things further.

That map above is a Hurricane Inundation Map, from FEMA, MEMA, NOAA and NHC. The analysis is by ME, a lowly NWS volunteer spotter who happens to be Boss Hogg here at Cranberry County Magazine. The map is based on the zany-weatherman-titled SLOSH model of storm surge inundation.

"Storm surge" is the water pushed onshore in a storm. If you're standing at the high tide mark and a ten foot storm surge comes ashore, you'll be under ten feet of water. You can call it a Deathflow or Liquid Doom if it gets your people moving more quickly.

These maps depict the estimated storm surge for Hull in the event of a direct-hit hurricane arriving at mean high tide. They also show what sort of storm would e required to flood certain areas. They do not depict freshwater inundation that could result from heavy rain, sewer backups, and river/stream overflow.

The maps work like this:

Light Green = Category 1 storm. The Halloween Gale is a good-although-offshore example of a Category 1 hurricane, while the Blizzard of '78, though not a hurricane, is also a good model for estimating this sort of damage/risk.

Dark Green = Category 2 hurricane. Hurricane Bob was a weak Category 2 hurricane. Yes, "weak" and "Category 2 hurricane" are funny words to string together.

Yellow = Category 3 hurricane. We have only had five Category 3 hurricanes since the Other Man arrived in 1620, the last one being Hurricane Carol in 1954.

Red = Category 4 storm. We've had one in recorded history, in 1635.

Flesh = 100 Year FEMA Flood Estimates. This is the "hundred year storm" you hear people speak of, although you have to go pre-Colombian to find evidence (marsh mud samples are analyzed for otherwise unexplainable sand layering to determine prehistoric hurricane histories for areas with dunes in front of marshes) of storms of this power striking New England. According to my research, we got tuned up on to this extent in the 1100s, the 1300s, and the 1400s.

As we were saying before, you people are in a Hull of a spot.
"We're surrounded!" "We're supposed to be surrounded, we're paratroopers Hull."
Yes, you are surrounded... by water, and you don't live on mountains. When the water rises, it likes to come and visit coastal communities. That is going to make things very sketchy in H-you-double hockey sticks.

Hull could go from peninsula to island very quickly if a hurricane came to town. These maps help give you an idea of what sort of risk you face.

Hull does catch a break, in that a hurricane is almost never going to land a direct hit on Hull. It will come ashore on the South Coast, Cape Cod or Rhode Island before reaching Hull, and that will blunt the effects somewhat.

Hull will also benefit from the fact that hurricanes historically have a tendency to right-hook just before hitting Cape Cod, thus keeping Chatham and Wellfleet between the hurricane and Hull. That effect is erased when the storm plows through Cape Cod Bay, of course.

You can analyze the map for yourself, although I do feel obliged to note that Hull High will be underwater in even minor storms. The roads out will be blocked as well.

Talk to old-timers who were on Hull for Hurricane Carol or even the 1938 hurricane. Locals know stuff that FEMA doesn't, as odd as that sounds. I disagree with FEMA on my own neighborhood (Duxbury Beach), and my hurricane pedigree only runs back to Hurricane Belle. Keepers of the Old School actually watched hurricanes hit Hull, something most FEMA kids can't say.

Hull does have some high ground (World's End is safe from most storms, I was somewhat disappointed to discover), and you should both 1) know where it is and 2) befriend people who live on it.

We can now move on to the Evacuation Map.

"Oh Baby, Please Don't Leave Me!"
This one is easier to read. Red means "They'd better leave," and Yellow means "You'd better leave, too."

Hull, in a hurricane, is a French word for "Flee." Pretty much everyone in town should give serious thought to a good Skedaddle. A good run is better than a bad stand. That water will be coming ashore angry.

You don't HAVE to go. However, the cop you read the Constitution to before the storm will also be the one who may have to pull you out of the floodwaters, so use your best discretion and stuff.

Hull will be a nightmare to evacuate. As anyone who drives home from a bar knows, there's really only one road out. Hull also enjoys the distinction of being the 4th smallest town by land area in the state, yet having one of the longer coastlines... while also being top 30 in population density.

Also note that you can be killed by a hurricane very far back from shore, even in areas not demarcated by either map. A river could overflow, power lines could fall, the winds could decapitate you with a pizza box, and you could very easily end up in a sharknado.

We want you alive. We want you alive for monetary reasons, as this site depends on you dropping by now and then. We want you alive for reasons of professional pride, i.e. "If they listened to me, they got out in time." We also want you alive for regular, nice-people reasons.

"I advocate hanging on as long as possible."


Check out MEMA Hurricane Inundation Maps for yourself... laugh at those less fortunate than yourself, while planning defense strategies for people trying to get into your house to seek refuge.


Monday, September 7, 2015

Eastham Hurricane Primer: Inundation and Evacuation


Eastham is a tough town to describe when viewed from above. There's not really a word for her shape. You could never sketch a map of Eastham from memory, like you could do with, say, Wyoming.

All of those coves and marshes and tidal creeks and barrier beaches combine to make a tricky hurricane forecast for the Easternmost Ham.

We have two maps for you to peruse. They come from an amalgamation of FEMA, MEMA, NOAA, and NHC. The map at the top of the page, and the ones in the article which look like it, are Hurricane Inundation Maps. They are based on the zany-weatherman-titled SLOSH model.

The Inundation maps are related to storm surge, which is seawater pushed inland ahead of a storm. Some of our past hurricanes have sent ashore some doozies. These maps show where storm surge is forecast to come ashore. They also purport to show how far inland storms of differing intensities will reach.

I'll leave the neighborhood-by-neighborhood discussion to the readers, who can zoom in on their particular house if they so desire by going to this page and clicking around a bit.


The picture quality is rough- I couldn't SAVE AS or PRTSC these pages for some reason which may be drug related, and instead took pictures of my screen with the girlfriend's phone- but a determined reader can figure out what they need to see.

Here is the color code we'll be using:

Light Green = Category 1 hurricane. That's the minimal kind, the weakest hurricane. The Halloween Gale is a good-if-offshore example of this kind of action.

Darker Green = Category 2 hurricane. While the landfall was far west of Eastham, Hurricane Bob was a Category 2 storm when it hit Rhode Island.

Yellow = Category 3 hurricane. Only five hurricanes of this intensity have hit New England since the people from Old England showed up, the last being Carol in 1954. Eastham's population was about 900 back then.

Red = Category 4 hurricane. They're estimating from almost 400 years ex post facto, but the Great Colonial Hurricane of 1635 may have been a Category 4 storm.

Flesh = 100 Year FEMA Flood Zone. This is the "hundred year storm." Brown University scientist-types measure pre-Colombian storm impacts by taking long tubes of marsh mud and analyzing sand layers which could only be put there by giant storms. New England was hit by Category 4+5 storms in 1100–1150, 1300–1400 (1295–1407), and 1400–1450 (1404–1446).

I'm no artist, and I use "flesh" as a color primarily because of whoever was in charge of Color Naming at Crayola in 1970. There's probably a better term. Inundation maps are very egalitarian, and due to their using White as a base color on the map, the "colored" neighborhoods are generally the less-swarthy waterfront-property-owning types of people.


Please note that these maps depict a scenario where a direct-hit hurricane arrives at mean high tide. Also note that they do not show impacts from freshwater flooding scenarios like heavy rainfall, freshwater stream overflow, sewer backups and even sociopaths spraying their garden hoses into the wind for the sheer joy of it.

A few quick notes about the maps:

-  A monster storm will reach inland far enough to cut off Route 6 in a few spots. You should try to be Ghost before that happens.

- Anything marshy will go under in a minimal hurricane.

- The only Flesh colors we see are on the outer dunes, and in a few spots by the fire station.

- I'm probably a bit late to this dance, but you could make a pretty good cheesy horror film about a hurricane flooding Eastham which also pushes sharks ashore to grab people out of The Friendly Fisherman and so forth.

- North Eastham should be called Nor'eastham.


We also have an Evacuation map for you. These are what the authorities use to determine who will be under evacuation orders.

You don't HAVE to evacuate, but that cop you told off before the storm may end up being the one who has to decide whether he should risk his neck to pull you out of a flood.

These maps are a bit easier to read than the Inundation maps. We only have two colors here. Red means Get Out, and Yellow means Get The F*** Out.

You should pay heed to these maps. We want you alive. We need your site visits, we have professional pride ("If they read my column, they'd be alive"), and we also want you alive for regular nice-person reasons.

"I advocate hanging on as long as possible."


Monday, August 24, 2015

Dartmouth Hurricane Information: Inundation and Evacuaton

"It's so cold in the D..."

Our continuing series on hurricane safety takes us today to the lovely town of Dartmouth.

Dartmouth is very large for a small town. They have 34,000 people, although that number is skewered by college students and summer people. Only a few, like God, Santa, and the fire chief, truly know how many people are in Dartmouth at any given moment. Only Plymouth and Middleboro have more land.

Dartmouth itself is divided between two general areas- North and South Dartmouth- and those two areas are divided into five villages or so. Once you get into the nuances and differences between Hixville (should really be more rural), Bliss Corner (should be nowhere but wherever UMD girls go to strip), and Padanaram (which sounds like a Euro death metal band name or perhaps even a level of Hell, but is actually a gorgeous, affluent area), ol' Steve taps out and admits that he's from Duxbury Beach.

Shoot, we're just hyper-analyzing aerial maps, and you really don't want to finalize your plans unless you wield great local knowledge (by "great," I mean "has been through several major storms in your area") or have spoken at length with a neighborhood old-timer. Locals know lots of stuff that pros don't, extra-especially neighborhood specific stuff. I'm just a NWS spotter with a web site, your neighborhood has old people who know more than I do, merely by experience.

But I am good for something, and that something is providing you with maps that contain important hurricane information that is specific to Dartmouth. You can review these maps right down to your very house, which is why I'm so cavalier when writing about towns I don't live in. Anything I don't know, you can figure out yourself by zooming in.

The map at the top of the page is a Hurricane Inundation map, and it basically tells you where the ocean will flood in a direct-hit hurricane striking at mean high tide. It is color-coded, with the colors showing the minimal storm intensity level (Saffir-Simpson hurricane scale, i.e. Category 1-5) that would flood a particular area.

Light green = Category 1... Hurricane Belle or Gloria were Category 1 affairs. If you washashored into Dartmouth from the South Shore, the Halloween Gale would be a good, strong Cat. 1.

Darker green = Category 2... Hurricane Bob was a strong 2, maybe a mild 3. Yes, I know that "mild" is a strange term to use before "Category 3 hurricane," but that's how we roll here in Cranberry County.

Yellow = Category 3.... you're talking historic doom here. Only 5 storms of this power have hit New England. You most likely know someone who was here for Donna (1960) and may even find a geezer who was around for The Great New England Hurricane (aka The Long Island Express, 1938). You want to talk to these people before they die, and vampire their wisdom for yourself.

Red = Category 4... You don't have to worry about this one, because if anything of this Katrina-level power is heading your way, you should be ghost... all the way to a Vermont hotel.

"Flesh" = 100 year storm, which should be a 500 year storm, seeing as we've had 500 years pass without one. I don't know what color to use for that, I went with the Crayola 1973 color name that came to mind. Call it "apricot" or even "off-whitey" if you like.

Pretty-please take note that this map is for seawater inundation, and does not include freshwater events like river flooding, sewer overflow, and heavy rainfall. You could drown 15 miles inland if the dice come up snake-eyes during a hurricane, and your surviving family would be wrong if they blamed Mother Ocean for it.

Dartmouth offers 31 flavors of Doom in a hurricane, and you could get your wig split by falling branches, lightning strikes, downed power lines, looters, sinkholes, sharknadoes, the National Guard, and divine retribution. We're just going to focus on seawater inundation and evacuation.

Speaking of evacuation...

Cell-phone map, player... the one in the links is better.

This map is easier to read. It has two levels of severity. Red means "these people have to go," and Yellow means "you also have to go."

I apologize for the scale. I'll throw some links at the end of the article for people who want to zoom in on Russells Mills or Pandemonium or wherever.

As you can see, 99.9% of the town will not require evacuation. However, many heads can be found in those colored areas (in this scenario, the rich white people with waterfront homes are the colored ones), and they should think about galloping the fudge out of town. A hurricane that is sizing up Dartmouth will be flying up at her unimpeded, and the collision will be historic.

Even if you live in a white neighborhood in the inundation map, you should consider fleeing. New England does not lack for trees, and it only takes one to make you a homeless person with a yard full of live, downed wires. It can be tough to get to/into a shelter once you realize that you'll need one.

Likewise, these evacuation zones are what the police will be working with in their storm planning. You don't HAVE to leave if the evacuation order is given, but you don't want to be relying on the 5-0 guy you read the Constitution to before the storm being the one who has to pull you out of the maelstrom once Mother Nature starts playing for blood.

Notice that Route 195 will be underwater in some spots during minor hurricanes, and will be a series of islands in a larger one. They kinda cut that ish close to the coast, especially in Nastypoisett.

Anyhow, that's the storm information I have. Learn it, know it, live it. I want you alive. My revenue stream is such that I can't afford to have any of my readers perish. I also have a soft sport for Dartmouth... UMD was one of the few schools to accept your author when he came out of high school. I got nothing but love for you.  "I advocate hanging on as long as possible..."


Hurricane Inundation Zone maps... from FEMA, MEMA, NWS, and NHC.... and ME. Zoom in on your neighborhood. Do some disaster porn! Speculate on the fate of people in other towns who you hate! Hours of weather-geeking fun!

Evacuaton Zone maps... make sure you don't evacuate into an area that is colored more harshly than yours, people.

Friday, August 21, 2015

Plymouth Hurricane Primer: Inundation and Evacuation In America's Hometown

Plymouth doesn't have the coastal flooding problems that towns like Duxbury have, which is amazing, because Plymouth has as much coastline as Scituate, Marshfield and Cohasset combined.

Plymouth floods, no doubt. If you've ever been in Bert's, and wondered why the big boulder was displayed inside.... the Blizzard of '78 put it there. A trip to Cedarville will show you several houses which are one storm away from a straw/camel's back scenario involving the seaside cliffs they rest on. Plymouth was also Ground Zero for the worst hurricane seen in New England by the palefaces, but we'll get to that in a moment.

Plymouth gets mad hurricane Disrespeck for several reasons. One, it is blocked by several barrier beaches, which range from as small as Long Beach to as large as Cape Cod. E/NE winds that push storm unimpeded waves across the mid-Atlantic towards towns like Scituate and Duxbury find a Cape Cod-sized roadblock when aiming at Plymouth.

The Cape, an dat ol' sketchy South Coast, also protect Plymouth from direct hit hurricane shots. Any storm that hits Plymouth has hit New Bedford or Wareham first, and those towns absorb a lot of the initial shock. I watched Hurricane Bob- which tore Cape Cod to shreds- from nearby Duxbury Beach, and the waves didn't even hit the seawall.

Plymouth has a wide variety of coastline designs, or whatever God calls it when He makes Ellisville different from Cedarville. You can park 100 feet from the shore at Bert's and have a wave break over your car. You're a few feet higher off the beach over by Issac's, and you're 8 stories above the waves at the same 33 yard distance if you are working the 18th hole at White Cliffs Country Club.

Plymouth also elevates rather quickly from the shoreline, so the ocean is unable to push that far inland, even with Katrina-style winds blowing behind it. That means very little to you if you live on Water Street, but it is why you don't see flooding miles inland like you do with Duxbury and Marshfield. This is also influenced by the heavily-wooded nature of Plymouth, as opposed to the just-add-ocean marshes in the Floodier towns to the north.

We have two maps for you to look over. The one at the top of the page is a Hurricane Inundation Map. That shows you what parts of Plymouth would flood in what intensity of hurricane. The people who make these maps (a group effort by FEMA, MEMA, NOAA and the NHC) are assuming a worst case, direct-hit scenario with full hurricane conditions striking at mean high tide.

The map DOES NOT account for freshwater, inland flooding. You're on your own there, homie... although you'd want to know how far you are from any river, and the relative elevation of your house. Shoot, 7 inches of rain will sweep some roads away, so be prepared.

The colors of the Inundation map work like this.... light green = Category 1, darker green = Category 2, yellow = Category 3 and red = Category 4. Plymouth has not had direct Category 4 hurricane conditions since the Pilgrims showed up. FEMA even takes a 100 Year Flood estimate for extreme scenarios, which is represented by the color Crayola used to call "flesh" until they realized that minority kids also like to color. I think it's called "Off Whitey" now.

Due to Plymouth's large size, it can be hard to distinguish some of the colors with the picture I have for you. You can solve that by going here. You can zoom in all you want from there.

The hardcore areas in town seem to be a Kingston border-to-Long Beach run. It's not so bad after that, as the hills of the coastline begin to assert themselves. You get some flat coastline- and a river mouth- right where the nuclear power station is. Pilgrim is in the Inundation zone, even for a moderate hurricane. It's odd using terms like "moderate" to describe something as ghastly as a hurricane, but this is how we do at the NWS.

If your street is any color but the white of the map background, you might want to start making plans on escaping. You might have to wait 50 years before you need to get Ghost, but it is better to have a plan and not need it than it is to need a plan and not have it.

Your plan would be influenced by the second map we have for you today, the Evacuation. Sounds biblical, no?

The proffered Evacution map is easier to follow. Red means "those people have to evacuate," and yellow means "so do you."


Plymouth takes her storm threats very seriously, and the police will be following this map as a guide for which streets and even which houses would be asked to leave when Mr. Hurricane comes knocking.

The immediate shoreline will be evacuated all through the town, even the cliffs areas. This is in effect even for a minimal huuricne. You don't have to leave if you don't want to, but you also don't want to be relying on the cop you told to f*ck off earlier to pull you out of the maelstrom. Irony and Karma both bite for the ass.

The bonus areas in Plymouth that might require inland evacuation are the Eel River area and Ellisville. You have to earn them with a higher-intensity storm, but the threat is real. Larger storms look to be a good bet to evacuate people out to 3A in White Horse Beach and all around the Eel River.

That's the cell phone version of the map, you can view the Evacuation map in more detail by clicking here.

Plymouth folk may have the tendency to disregard hurricane preparations, as they have large land masses taking the heavy shots for them. However, history paints such people as fools, because Harry Cane can f*ck you up smooth in Pilgrim Town. He has before.

Remember, we're only about 380 years removed from the Great Colonial Hurricane.That powerful 1635 storm dropped in unannounced on the Pilgrims, and blew down everything in sight. Experts say that it may have been the worst East Coast hurricane since European colonization, and hit Plymouth (after coming ashore along the CT/RI border) as a Category 3 monster. It may have been Category 5 further south of us.

A storm like that would be bad, bad news for Plymouth, and that would be BEFORE we factored in the inundated nuclear power plant.

Keep your head up, people. This magazine relies heavily on your site visits, and my lifestyle can not afford to have Plymouth residents dying en masse. We've got nothing but love for you.

Saquish, pictured in the background below, would be an island in a hurricane. Rotten last paragraph, I know, but I like to end articles with nature shots.


Monday, August 17, 2015

Marshfield Hurricane Primer: Inundation And Evacuation


Where do you start with Marsh Vegas?

It's more of a nor'easter town than a hurricane town, but A does not necessarily preclude B in this case. Marshfield is cap-ee-tull-T Trouble in any coastal storm situation, just because of the lay of the land. That's not going to improve if the winds get over 100 mph.

For starters, they didn't name the town Marshfield because some guy named Marsh founded it. Marshes, moors, swamps, bogs and estuaries all define the town''s geography. You can't be the green-bleeding heart of the Irish Riviera without some bogs to trot on, no?

Marshfield's eponymous marshes and her river mouths (you expect the North River to be trouble, but the itty-bitty Green Harbor River?) ensure that a lot of water will be flowing through and collecting in Marshfield during any rain event. That's before we factor in the waves breaking over houses.

The map above is what they call a Hurricane Inundation Map. It's what floods in town, and note that these estimates are only for salt water flooding. They assume a direct hit (almost impossible in Marshfield's case) from a hurricane at mean high tide.

The map (provided by the NHC and FEMA) is a bit tough to read, as tidal flooding far inland made for a need to zoom the map out. You can still see enough to know, and local knowledge is probably as good as any map.

Of course, your local knowledge isn't top-notch until you can trace your residency back to a signature storm like Hurricane Carol, the Blizzard of '78 or the Halloween Gale. You can always talk up the longest-standing resident of the neighborhood for local flooding history, and any solid plan for a coastal resident should include such considerations.

The light green areas on the map are areas that would be underwater in a Category 1 hurricane. Darker green is Category 2, and yellow is Category 3. Keep in mind, five Category 3 hurricanes have hit New England since the white man arrived. FEMA also provides areas (the reddish shade) that would get hit in a Category 4 storm, which we have not had in modern history. That scenario almost-but-not-quite puts the Dairy Queen under seawater.

The authorities are also nice enough to give us Evacuation Maps. These are a bit more broad-stroked and are much easier to read.

Basically, red means "those people have to go," while yellow means "and you have to go, too."

Marshfield is an odd geographical thing, very close to sea level, and even the high ground drains downhill into the marshes. Areas of Marshfield that shake off a nor'easter with just some frozen spray on the houses may be in for a rude awakening if a Bob-style hurricane unloads on her. Once those marshes top off, the water has nowhere to go except into the neighborhoods.

Much of the area's coast (hello, Rexhame and Humarock) is wedged between the sea and the South River, which only aids the inundation process... which, in turn, spurs along the need to evacuate.

Most of Marshfield's coast- and any areas along rivers or marshes- would have to be evacuated in even a minimal hurricane forecast to hit at high tide. Greater storms would force people near the Fairgrounds to evacuate.

A solid run from the Duxbury border, through Green Harbor, Brant Rock, Ocean Bluff, Fieldston, and Rexhame to the tip of Humarock would be Gotta Goville. I'm guessing, but at the height of summer, that might be 10,000 people.

From what I can see of the maps, people might want to head for the (Marshfield) Hills.

It's like we say on Duxbury Beach... "The other 364 days of the year are beautiful."

If you want to play with the maps or get the links to other towns, maybe see how bad the other suckers near you are gonna get it.... FEMA Inundation Maps For Massachusetts.

You can also window-shop other town's disaster porn with the FEMA Evacuation Zone Maps For Massachusetts.

Marsh Vegas, as you can see, gets wrecked on the regular.