Showing posts with label noaa. Show all posts

Thursday, April 7, 2016

South Coast-al Flooding Tonight, Snow Saturday Night?


It sure has been a wild weather week, and it will only get worse as we head through the weekend.

Remember, it snowed earlier this week. That was an April snow, and it was a top 20 event for April snow in some locales. We then ad our temperatures plunge, which also approached some records. After that, the wind kicked in.

I'm watching a tree in my neighbor's yard, and it looks 50/50 on toppling. I'm sort of East of it, and it looks like it will topple North. If this column ends suddenly on, that's probably what happened.

We have a Gale Warning for the ships at sea, and a Wind Advisory for the landlubbers. Winds will gust from the S/SW near 50 MPH today through about 9 PM or so. This wind could take down some tree limbs and cause isolated power outages. It would be worse if there was snow, but we'll get to snow in a moment.

We also have a Coastal Flood Advisory for south-facing beaches and the people who love them. High tides will be between 8:30 and 9:30 for most spots. This is the spring new moon tide, always trouble for anyone on the coast, especially if there is a big wind.

Minor to moderate coastal flooding is possible, as the winds are really making the seas angry, my friend. This flooding won't knock down your house, but it can still cause all sorts of trouble. a 2 foot storm surge is possible, thanks to Wendy Gust.

As always, we do try to remind coastal residents in our coverage area to never do yard work until (at the earliest) late April. Having to hustle to get the yard ready for Mother's Day or Memorial Day sucks, but it's harder to do the job twice when we get one of those Ides Of April storms.


After that, we get a night's rest, and then we can start worrying about the snow that may be coming Saturday night. One of those Alberta Clipper things will streak south of us, and her northern fringe may put us in the powder on April friggin' 9th.

It may start as rain, but it should turn to snow as the storm pulls away from 'Murica and the cold air piles in behind it. We could be in the 20s overnight Saturday.

Opening Day at ol' Fenway is Monday. The Boston Marathon is a week from Monday.

This won't be a snowstorm that buries you to the point where somebody has to go get a St. Bernard dog. It would most likely be a coating to an inch, and that indeterminate total will mostly fall south of Boston.

The snow, should we get it, would be notable more for her timing than her ferocity. We're taking April 9th into April 10th, folks. Wishing for a beach day, getting a snow day.... ayup.

Here's a forecast map of the Clipper going off the coast on Saturday, with most of MA already getting snow:

Saturday, April 2, 2016

A Bit Of April Snow For You?


Maybe we were a bit hasty with that Last Snow headline in late March...

It seems that we have not one but TWO snow events coming at us... and that's just through Monday morning. Although some April snow is newsworthy, the real story will be the combo of wind and cold heading for us.

We were pushing 70 degrees around here on Thursday and Friday. We'll be in the 20s on Sunday, with places north of us diving into the teens.

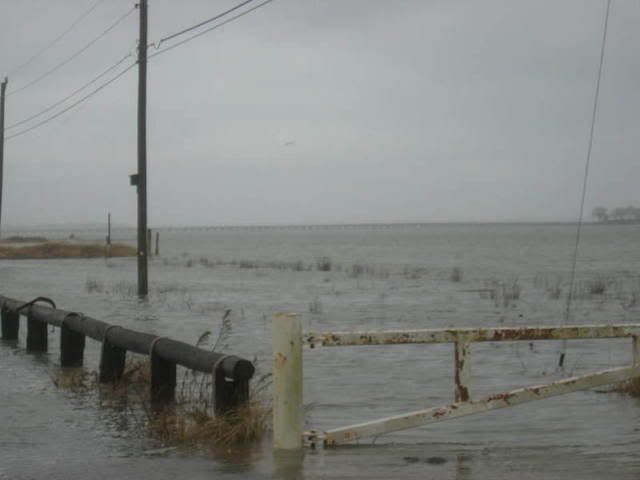
We also want to tag in now to let you know that there is a chance of coastal flooding at the end of next week. We'll get to that in a second.

Why not let the National Weather Service explain? They just published a detailed forecast for the whole active weather period. They use ALL CAPS, so it is obviously important stuff of which they speak:


RAIN TODAY WITH THE POSSIBILITY OF ISOLATED THUNDERSTORMS ACROSS
THE INTERIOR. INTENSE STORM SYSTEM EARLY SUNDAY MORNING. BURST OF
ACCUMULATING SNOW LIKELY. HURRICANE FORCE WINDS POSSIBLE. THEN AN
UNSEASONABLY COLD AIRMASS OVERSPREADS THE REGION SUNDAY AFTERNOON
AND NIGHT WITH BLUSTERY NORTHWEST WINDS. ANOTHER LOW PRESSURE
TRACKS OVER OR NEAR THE SOUTH COAST OF NEW ENGLAND
MONDAY...BRINGING THE RISK FOR ANOTHER ROUND OF ACCUMULATING SNOW
TO THE AREA. DRYING TREND TUE BUT REMAINING UNSEASONABLY COLD.
MODERATING TEMPERATURES MID TO LATE NEXT WEEK BUT ALSO THE RISK OF
WET WEATHER.

&&

.NEAR TERM /UNTIL 6 PM THIS EVENING/...

7 AM UPDATE ...

NOT MUCH CHANGE FROM PREVIOUS FORECAST. RAIN SHIELD /MAINLY LIGHT/
CONTINUES TO OVERSPREAD RI AND EASTERN MA...WITH LITTLE IF ANY
RAIN NORTHWEST OF BOSTON TO PROVIDENCE CORRIDOR. FOR WHAT IT/S
WORTH THE 06Z NAM AND GFS BOTH TRENDED HEAVIER WITH RAINFALL LATER
THIS MORNING AND EARLY AFTERNOON ACROSS RI AND EASTERN MA. LOW
CONFIDENCE ON THIS SCENARIO WILL CONTINUE TO LEAN TOWARD LIGHT TO
PERHAPS MODERATE RAIN AT TIMES...HEAVIEST RI AND EASTERN MA WITH
LIGHTER RAIN ACROSS CT AND WESTERN-CENTRAL MA.

ONLY CHANGE TO THE FORECAST WAS TO LOWER HOURLY TEMPS A BIT AS
RAIN HAS LOWERED TEMPS CLOSER TO THEIR WET BULB VALUES. OTHERWISE
PREVIOUS FORECAST ON TRACK. EARLIER DISCUSSION BELOW.

===================================================================

INITIAL LIGHT TO MODERATE RAINFALL EVENT FOLLOWED UP BY A SWEEPING
COLD FRONT AND SOME CONVECTIVE SHOWERS.

SO WITH THE FIRST SYSTEM...WAVE LOW DEVELOPS ALONG THE STALLED
FRONTAL BOUNDARY OFFSHORE PARENT WITH STOUT MID LEVEL ENERGY AND
FORCING THROUGH THE OVERALL BROAD CYCLONIC TROUGH. GREATEST POP
CHANCES AND RAINFALL S AND E CLOSER TO THE SKIRTING WAVE LOW. MUCH
OF THE ACTIVITY EARLY MORNING INTO MIDDAY.

THEN SECONDLY...ATTENTION TURNS N/W WITH THE FIRST IN A SERIES OF
LOW PRESSURE CENTERS THAT BEGIN THE PROCESS OF DRAGGING COLDER AIR
ACROSS OUR REGION. IN TANDEM WITH A SWEEPING COLD FRONT WILL SEE THE
BOUNDARY LAYER COOL AND BECOME UNSTABLE UP TO H6. IF THE 24-HR HRRR
IS CORRECT...LOOKING AT CONVECTIVE SHOWER DEVELOPMENT AHEAD OF THE
FRONT ESPECIALLY ACROSS THE N/W/CENTRAL INTERIOR. STRONG LOW-MID
LEVEL FORCING TO THE TOP OF THE LAYER AROUND -20C COULD RESULT IN
GRAUPEL / SMALL HAIL WITH THESE SHOWERS ALONG WITH LIGHTNING...AS
WELL AS 20-30 MPH GUSTS. THREATS EXACERBATED IF WE SEE CLEARING
BETWEEN THE S STREAM WAVE LOW AND N STREAM SWEEPING COLD FRONT. WITH
ANY THUNDER MENTIONED IN THE FORECAST WILL APPEND GUSTY WINDS AND
SMALL HAIL. THREATS SWEEPING NW TO SE DURING THE LATER HALF OF THE
DAY INTO EVENING. INSTABILITY NOT AS ROBUST AS FRIDAY...SO THINKING
STORMS WILL NOT REACH WARNING CRITERIA.

OVERALL A MOSTLY CLOUDY AND COOL DAY IN ADDITION TO THE WET WEATHER.
HIGHS INTO THE 50S.


.SHORT TERM /6 PM THIS EVENING THROUGH 6 PM SUNDAY/...

TONIGHT INTO SUNDAY...

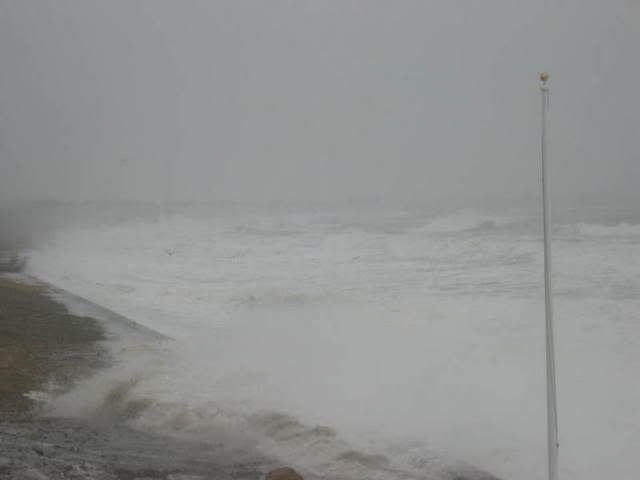
 * STRONG TO DAMAGING WINDS NEAR HURRICANE FORCE POSSIBLE
 * WIND ADVISORY / HIGH WIND WATCH POSTED
 * CONVECTIVE SNOWS POSSIBLE WITH ACCUMULATIONS 1 TO 3 INCHES
 * STORM FORCE WINDS ACROSS THE WATERS

SNOW BURST EARLY SUNDAY MORNING INTO MIDDAY ACCOMPANIED WITH STRONG
TO DAMAGING WINDS. WILL BE AN UNPRECEDENTED RARE EVENT INCORPORATING
RAPID CYCLOGENESIS...INTENSE LIFT...AND ACCUMULATING SNOWS AS WELL
AS THE LIKELIHOOD OF THUNDERSNOW. SHOULD SEE IMPACTS TAPER DOWNWARD
LATE AFTERNOON INTO SUNDAY EVENING. AFRAID MANY ARE GOING TO BE
CAUGHT OFF-GUARD WITH THE LATE SEASON SNOW. WILL HIT ON THE DETAILS
BELOW AS BEST AS POSSIBLE.

POTENT VORTEX OUT OF THE GREAT LAKES REGION CYCLONICALLY DIGGING S
OF NEW ENGLAND INVOKES INTENSE CYCLOGENESIS ALONG THE S-SHORELINE.
THIS WHILE DRAGGING CONSIDERABLY COLDER AIR ACROSS THE REGION WITH
H85 TEMPERATURES FALLING -10 TO -15C NEAR RECORD BREAKING PER LOCAL
SOUNDING CLIMATOLOGY. STRONG LOW TO MID FORCING ABOVE SURFACE INFLOW
AND BENT-BACK WARM FRONT WITH COLD AIR ADVECTION REARWARD RESULTING
IN THE ATMOSPHERIC COLUMN BECOMING SUPER-ADIABATIC / UNSTABLE UP TO
H6 BENEATH THE TROPOPAUSE FOLD. ENSEMBLE CLIMATOLOGICAL PERCENTILES
SHOWING THIS EVENT TO BE NEAR OR AT ALL-TIME HISTORICAL MINIMUMS...
IMPRESSIVELY ANOMALOUS.

TEMPERATURES / PRECIPITATION INTENSITY....CRITICAL WITH THIS EVENT
IS THE PRECIPITATION INTENSITY DETERMINING PRECIPITATION TYPE...AS
WELL AS 2M SURFACE TEMPERATURES. WILL DRIVE SUCH TEMPERATURES CLOSE
TO IF NOT AT THE WET-BULB DURING EXPECTED TIME-FRAME OF INTENSE
PRECIPITATION. INITIAL RAIN WHICH HAS INSTABILITY TO WORK WITH AS
THE COLUMN BEGINS TO COOL TO COULD YIELD GRAUPEL/SMALL HAIL WITH
ANY THUNDERSTORMS. BRIEF BEFORE CHANGING OVER QUICKLY TO A INTENSE
SNOWFALL.

SNOWFALL...ALONG SHORES EXPECT LITTLE IF ANY ACCUMULATION ADJACENT
TO WARMER WATERS. LOW ELEVATIONS EXPECTING SLUSHY ACCUMULATIONS ON
ELEVATED / GRASSY SURFACES WITH WET ROADWAYS. AND FINALLY N/W AND
ACROSS HIGH TERRAIN WITH COLDER TEMPERATURES THERE IS A GREATER
OPPORTUNITY AND MORE CONCERN FOR SNOW ACCUMULATION ON ALL SURFACES
WITH HIGHEST SNOWFALL AMOUNTS ATOP BERKSHIRES / WORCESTER HILLS.
SNOW EXPECTED TO OCCUR QUICKLY...IN A SHORT DURATION...ON THE ORDER
OF 1 TO 2 HOURS. STORM TOTAL ACCUMULATIONS 1 TO 3 INCHES AWAY FROM
THE COASTAL PLAINS.

THUNDERSNOW...PRECIPITATION SHOULD BE INTENSE CONSIDERING THE SUPER-
ADIABATIC / UNSTABLE LAPSE RATES. BENEATH THE POTENT VORTEX YIELDING
RAPID CYCLOGENESIS...LOOKING AT LIFT OF 50 MICROBARS PER SECOND IN
SNOW GROWTH REGIONS. DEFINITELY A SIGNAL FOR THUNDERSNOW. WILL PUT
AN ISOLATED MENTION INTO THE FORECAST. INTENSE ENOUGH...WOULD EXPECT
SNOW ACCUMULATION ON A MAJORITY OF SURFACES...EVEN AT THE LOWER
ELEVATIONS. COULD SEE 1 INCH PER HOUR SNOWFALL RATES. COMPLEX TO
FORECAST.

WINDS...INTENSE PRESSURE COUPLET YIELDING HURRICANE FORCE WINDS AT
H925 ACROSS NJ / DELMARVA EXTENDING ON UP ACROSS SE NEW ENGLAND AS
THE STORM EXITS LATE MORNING TO MIDDAY SUNDAY. WITH INCREDIBLY STEEP
LAPSE RATES...UNDOUBTEDLY A MAGNITUDE OF SUCH WINDS WILL MIX DOWN TO
THE SURFACE. 35 TO 55 MPH WINDS ACROSS INTERIOR NEW ENGLAND N TO S
WITH 50 TO 70 MPH WINDS ACROSS RHODE ISLAND AS WELL AS E/SE MASS.
HIGH CONFIDENCE FOR WIND ADVISORY CONDITIONS OVER ALL S NEW ENGLAND.
LOWER CONFIDENCE ON WHERE EXACTLY HIGH WIND WARNING CRITERIA WILL
BE MET. WENT WITH A WATCH OVER E/SE NEW ENGLAND.


.LONG TERM /SUNDAY NIGHT THROUGH FRIDAY/...

HIGHLIGHTS...

* VERY ACTIVE WEATHER PATTERN NEXT 7 DAYS

* TEMPERATURES - UNSEASONABLY COLD FOR EARLY APRIL SUNDAY THROUGH
  WEDNESDAY...THEN MODERATING LATE NEXT WEEK

* PRECIPITATION - ACCUMULATING SNOW LIKELY MONDAY ALONG WITH OCEAN
  EFFECT SNOW SHOWERS EASTERN MA TUE MORNING. OTHERWISE DRY TUE INTO
  WED FOLLOWED BY WET WEATHER LATE NEXT WEEK

SUNDAY NIGHT ... MODELS HAVE SPED UP THE ARRIVAL OF THE NEXT SYSTEM
WITH SNOW POSSIBLY BEGINNING BEFORE SUNRISE MONDAY ACROSS WESTERN
PORTIONS OF CT AND MA. THUS TEMPS SUN NGT WILL NOT BE AS COLD AS
PREVIOUSLY THOUGHT. ALTH STILL UNSEASONABLY COLD. OTHERWISE DRY
WEATHER PREVAILS MUCH OF THE NIGHT WITH A VERY COLD AIRMASS IN
PLACE WITH TEMP ANOMALIES AT 925 AND 850 ABOUT -2 STANDARD
DEVIATIONS COLDER THAN CLIMO. THIS WILL RESULT IN TEMPS FALLING
INTO THE 20S REGIONWIDE ALONG WITH A FEW UPPER TEENS ACROSS
NORTHWEST MA. NORMAL OVERNIGHT LOWS SHOULD BE 30- 35 FOR EARLY
APRIL.

MONDAY ... AS MENTIONED ABOVE MODEL GUIDANCE HAS SPED UP ARRIVAL AND
DEPARTURE OF SNOW FROM FRONTAL WAVE. 00Z GFS IS ON THE NORTHERN EDGE
OF THE GUID WITH SFC LOW TRACKING ALONG THE SOUTH COAST...RESULTING
IN PTYPE ISSUES /RAIN & SNOW/ ACROSS CT/RI AND SOUTHEAST MA.
MEANWHILE REMAINDER OF GUID INCLUDING 00Z NAM/ECMWF/GEFS AND 12Z EPS
ARE FARTHER SOUTH AND COLDER. GIVEN TIME RANGE HERE AND SMALL
FRONTAL SCALE SYSTEM A MODEL BLEND IS LIKELY MOST SKILLFUL. THUS
WILL USE A BLEND APPROACH HERE. REGARDING QPF...00Z ECMWF/GFS/GEFS
AND 12Z EPS SUPPORT POTENTIAL QPF OF 0.20 TO 0.50 INCHES ACROSS THE
REGION. PRELIMINARY SNOW FORECAST VERY DIFFICULT AT THIS TIME RANGE
ESPECIALLY WITH SMALL FRONTAL WAVE IN ADDITION TO POTENTIAL PTYPE
ISSUES. FURTHERMORE ACCUMULATING SNOW ON PAVED SURFACES IN APRIL SNOW
EVENTS /HIGH SUN ANGLE...WARM GROUND AND LONGER DAYS THAN NIGHTS/
HINGE ON INTENSITY OF QPF. IF INTENSITY IS LACKING MOST ACCUMULATION
IS CONFINED TO THE COLDER SURFACES/HIGHER TERRAIN AND SECONDARY
ROADS. JUST TOO EARLY FOR ANY INSIGHT WHERE HEAVIER SNOW BANDS
WOULD POTENTIALLY SETUP. STAY TUNED.

MON NIGHT AND TUESDAY ... VERY PROGRESSIVE SYSTEM SO A DRYING TREND
THIS PERIOD. THE EXCEPTION WILL BE OVER COASTAL PLYMOUTH
COUNTY...CAPE COD AND NANTUCKET WHERE NORTHEAST WINDS AND STEEP LOW
LEVEL LAPSE RATES LIKELY RESULT IN OCEAN EFFECT SNOW BANDS. THIS IS
COURTSEY OF VERY COLD AIR ADVECTING IN ON BACKSIDE OF DEPARTING
SURFACE WAVE. IN FACT THIS AIRMASS WILL BE JUST AS COLD IF NOT
COLDER THAN SUNDAY/SUNDAY NIGHT/S AIRMASS WITH H85 TEMPS DOWN TO -
15C 12Z TUE! OTHERWISE EXPECT A VERY CHILLY DAY TUE WITH MUCH OF THE
AREA DRY WITH THE EXCEPTION OF SOUTHEAST MA AS MENTIONED ABOVE. VERY
BLUSTERY IN THE MORNING ACROSS SOUTHEAST MA WITH DEPARTING WAVE AND
1033 MB HIGH ENTERING THE GREAT LAKES.

WED ... LOOKS TO BE A TRANSITION DAY WITH COLD ANOMALOUS TROF
MOVING OFFSHORE AND HIGH PRES BUILDING INTO THE REGION. OFF TO A
COLD START BUT AIRMASS MODIFYING DURING THE DAY. DRY WEATHER
SHOULD PREVAIL BUT RISK OF PRECIP WED NIGHT PENDING SPEED OF NEXT
UPSTREAM SYSTEM.

THURSDAY AND FRIDAY ... COLD ANOMALOUS TROUGH MOVES OFFSHORE SO
TEMPS WILL REBOUND TO MORE SEASONAL LEVELS /50S/. HOWEVER MEAN
TROUGH RELOADS OVER THE GREAT LAKES AND OH VLY. THIS RESULTS IN A
STRONG FRONTAL BOUNDARY APPROACHING THE REGION WITH STRONG WAA
PATTERN INTO SRN NEW ENG. MODELS THEN DIFFER ON LATITUDE OF FRONTAL
WAVE DEVELOPING ON THE FRONT. NONETHELESS UNSETTLED WEATHER LATE
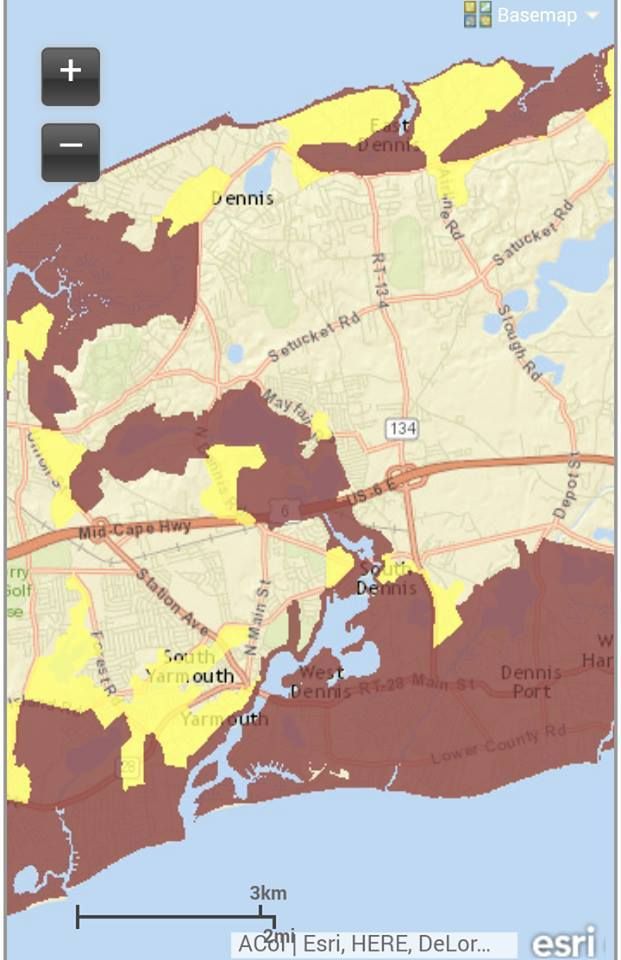
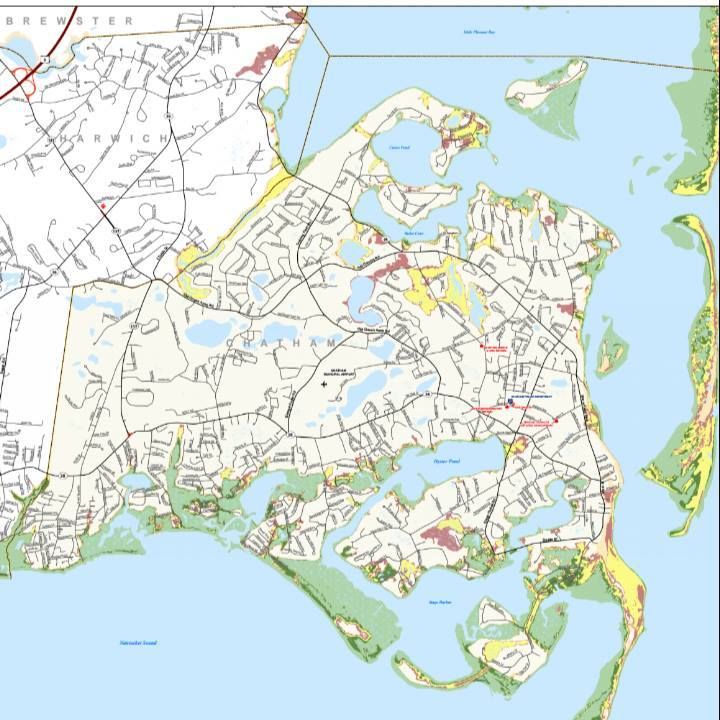
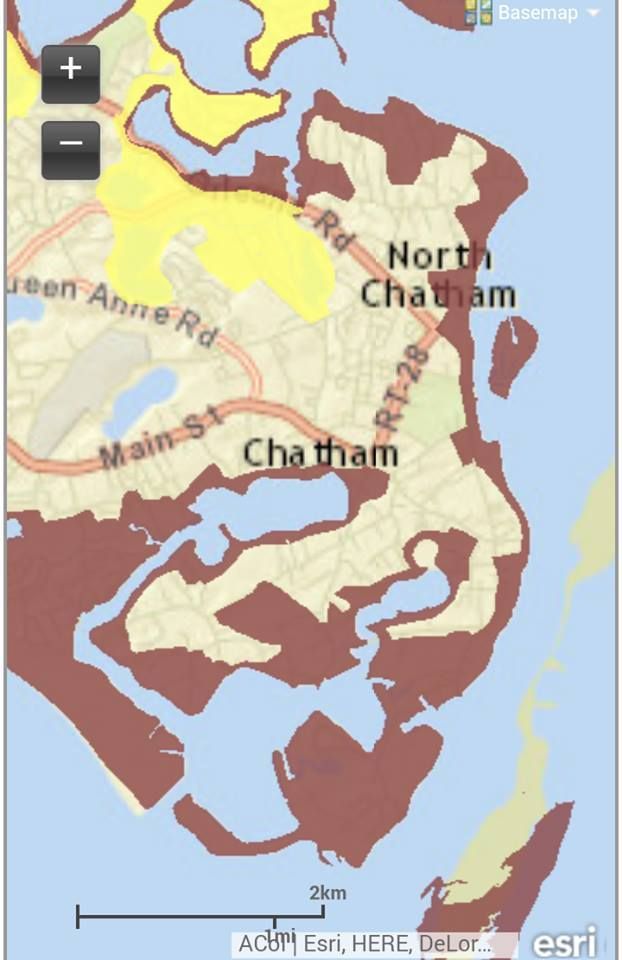
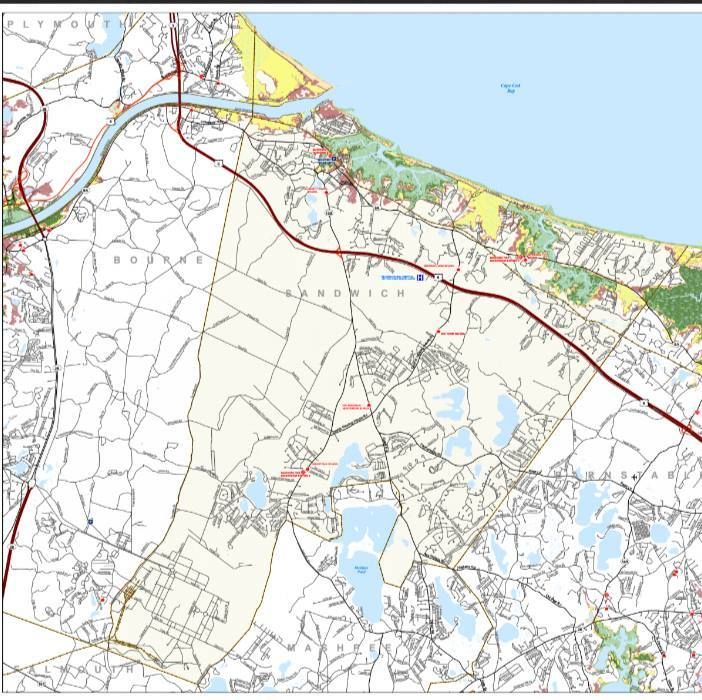
NEXT WEEK. ALSO WILL HAVE TO WATCH INTENSITY AND DURATION OF ANY
COASTAL LOW/FRONTAL WAVE AS ASTRONOMICAL TIDES ARE VERY HIGH...12.0+
FT AT BOSTON. HENCE RISK OF COASTAL FLOODING.


Tuesday, September 29, 2015

Fall River Hurricane Planner


We have two maps from FEMA to check out today. The map above is a Hurricane Inundation map, and it depicts storm surge from a direct hit hurricane visiting Fall River at mean high tide. It also shows what sort of storm would be needed to soak certain regions, which we'll get to in a minute.

The map is from the combined efforts of FEMA, MEMA, NOAA and the NHC. They use the funny-weatherman-titled SLOSH model of storm surge estimation. They do not depict freshwater flooding.

The colors relate to the Saffir-Simpson scale of hurricane intensity, and break down like this:

Light Green = Category 1 hurricane. Hurricane Gloria was one of these, and the offshore Halloween Gale was, too. Although not a tropical system, the Blizzard of '78 did Cat. 1-style damage.

Dark Green = Category 2 hurricane. Hurricane Bob was one of these.

Yellow = Category 3 hurricane. We've only had five of these hit New England since the Other Man arrived in 1620, the most recent being Hurricane Carol in 1954.

Pink = Category 4 hurricane. We've had one in recorded New England history, and it struck in 1635.

Flesh = One Hundred Year FEMA Food Zone. This is the "100 year storm" you hear people speak of, but you have to go pre-Colombian to find them ("going pre-Colombian" means using salt marsh soil samples to look for sand layering associated with large hurricanes). New England has had storms in the Category 4+ level in the 1100s, the 1300s, and the 1400s.

Sorry about Flesh, but my knowledge of color names was and continues to be heavily influenced by whoever was in charge at Crayola in the 1970s.

We shall leave the street-by-street analysis to the reader, who can use the links I'll throw in at the end of the article to zoom in on their own house if it suits them.

Note that you don't need to be in a shaded area to get yourself a quick and sudden Ending. You can have a tree fall on you, have your car washed out in street flooding, step on a downed power line, get purged by looters, enjoy the Robespierre treatment from flying shingles, be summarily executed by National Guardsmen, or even stumble into a sharknado. There's no shortage of ways for you to get Left.

With that in mind, we now present to you the down-there-somewhere Evacuation Zone map.

Remember, you don't HAVE to leave when 5-0 tells you to. Also remember that the cop you read the Constitution to before the storm may be the one who has to fish you out of the drink when the ship hits the fan.

The E-map is easier to read, as it is made up of only two colors.

Red = Get Out.

Yellow = Get the f*** out.


Hurricane Inundation Maps

Evacuation Maps

Worst Hurricanes To Hit New England

List of all hurricanes to hit New England


Current projections of Tropical Storm Joaquin's path:


Mashpee Hurricane Planner


We have two maps from FEMA to check out today. The map above is a Hurricane Inundation map, and it depicts storm surge from a direct hit hurricane visiting Mashpee at mean high tide. It also shows what sort of storm would be needed to soak certain regions, which we'll get to in a minute.

The map is from the combined efforts of FEMA, MEMA, NOAA and the NHC. They use the funny-weatherman-titled SLOSH model of storm surge estimation. They do not depict freshwater flooding.

The colors relate to the Saffir-Simpson scale of hurricane intensity, and break down like this:

Light Green = Category 1 hurricane. Hurricane Gloria was one of these, and the offshore Halloween Gale was, too. Although not a tropical system, the Blizzard of '78 did Cat. 1-style damage.

Dark Green = Category 2 hurricane. Hurricane Bob was one of these.

Yellow = Category 3 hurricane. We've only had five of these hit New England since the Other Man arrived in 1620, the most recent being Hurricane Carol in 1954.

Pink = Category 4 hurricane. We've had one in recorded New England history, and it struck in 1635.

Flesh = One Hundred Year FEMA Food Zone. This is the "100 year storm" you hear people speak of, but you have to go pre-Colombian to find them ("going pre-Colombian" means using salt marsh soil samples to look for sand layering associated with large hurricanes). New England has had storms in the Category 4+ level in the 1100s, the 1300s, and the 1400s.

Sorry about Flesh, but my knowledge of color names was and continues to be heavily influenced by whoever was in charge at Crayola in the 1970s.

We shall leave the street-by-street analysis to the reader, who can use the links I'll throw in at the end of the article to zoom in on their own house if it suits them.

Note that you don't need to be in a shaded area to get yourself a quick and sudden Ending. You can have a tree fall on you, have your car washed out in street flooding, step on a downed power line, get purged by looters, enjoy the Robespierre treatment from flying shingles, be summarily executed by National Guardsmen, or even stumble into a sharknado. There's no shortage of ways for you to get Left.

With that in mind, we now present to you the down-there-somewhere Evacuation Zone map.

Remember, you don't HAVE to leave when 5-0 tells you to. Also remember that the cop you read the Constitution to before the storm may be the one who has to fish you out of the drink when the ship hits the fan.

The E-map is easier to read, as it is made up of only two colors.

Red = Get Out.

Yellow = Get the f*** out.


Wednesday, September 23, 2015

Westport Hurricane Planner

Nothing should be West of Westport, but I didn't draw this map....

There are no imminent storms, Westport is just next up to bat in our ongoing series.

We have two maps from FEMA to check out today. The map above is a Hurricane Inundation map, and it depicts storm surge from a direct hit hurricane visiting Westport at mean high tide. It also shows what sort of storm would be needed to soak certain regions, which we'll get to in a minute.

The map is from the combined efforts of FEMA, MEMA, NOAA and the NHC. They use the funny-weatherman-titled SLOSH model of storm surge estimation. They do not depict freshwater flooding.

The colors relate to the Saffir-Simpson scale of hurricane intensity, and break down like this:

Light Green = Category 1 hurricane. Hurricane Gloria was one of these, and the offshore Halloween Gale was, too. Although not a tropical system, the Blizzard of '78 did Cat. 1-style damage.

Dark Green = Category 2 hurricane. Hurricane Bob was one of these.

Yellow = Category 3 hurricane. We've only had five of these hit New England since the Other Man arrived in 1620, the most recent being Hurricane Carol in 1954.

Pink = Category 4 hurricane. We've had one in recorded New England history, and it struck in 1635.

Flesh = One Hundred Year FEMA Food Zone. This is the "100 year storm" you hear people speak of, but you have to go pre-Colombian to find them ("going pre-Colombian" means using salt marsh soil samples to look for sand layering associated with large hurricanes). New England has had storms in the Category 4+ level in the 1100s, the 1300s, and the 1400s.

Sorry about Flesh, but my knowledge of color names was and continues to be heavily influenced by whoever was in charge at Crayola in the 1970s.

We shall leave the street-by-street analysis to the reader, who can use the links I'll throw in at the end of the article to zoom in on their own house if it suits them.

Note that you don't need to be in a shaded area to get yourself a quick and sudden Ending. You can have a tree fall on you, have your car washed out in street flooding, step on a downed power line, get purged by looters, enjoy the Robespierre treatment from flying shingles, be summarily executed by National Guardsmen, or even stumble into a sharknado. There's no shortage of ways for you to get Left.

With that in mind, we now present to you the down-there-somewhere Evacuation Zone map.

Remember, you don't HAVE to leave when 5-0 tells you to. Also remember that the cop you read the Constitution to before the storm may be the one who has to fish you out of the drink when the ship hits the fan.

The E-map is easier to read, as it is made up of only two colors.

Red = Get Out.

Yellow = Get the f*** out


Sorry about the map, but you can see a better version by using the links

Bone up on some cool, hurricane-related information!

Hurricane Inundation Maps

Evacuation Maps

Worst Hurricanes To Hit New England

List of all hurricanes to hit New England


  1. 0

    Add a comment


    1.  


      There are no imminent storms, Dennis-Yarmouth are just next up to bat in our ongoing series.

      We have two maps from FEMA to check out today. The map above is a Hurricane Inundation map, and it depicts storm surge from a direct hit hurricane visiting D-Y at mean high tide. It also shows what sort of storm would be needed to soak certain regions, which we'll get to in a minute.

      The map is from the combined efforts of FEMA, MEMA, NOAA and the NHC. They use the funny-weatherman-titled SLOSH model of storm surge estimation. They do not depict freshwater flooding.

      The colors relate to the Saffir-Simpson scale of hurricane intensity, and break down like this:

      Light Green = Category 1 hurricane. Hurricane Gloria was one of these, and the offshore Halloween Gale was, too. Although not a tropical system, the Blizzard of '78 did Cat. 1-style damage.

      Dark Green = Category 2 hurricane. Hurricane Bob was one of these.

      Yellow = Category 3 hurricane. We've only had five of these hit New England since the Other Man arrived in 1620, the most recent being Hurricane Carol in 1954.

      Pink = Category 4 hurricane. We've had one in recorded New England history, and it struck in 1635.

      Flesh = One Hundred Year FEMA Food Zone. This is the "100 year storm" you hear people speak of, but you have to go pre-Colombian to find them ("going pre-Colombian" means using salt marsh soil samples to look for sand layering associated with large hurricanes). New England has had storms in the Category 4+ level in the 1100s, the 1300s, and the 1400s.

      Sorry about Flesh, but my knowledge of color names was and continues to be heavily influenced by whoever was in charge at Crayola in the 1970s.

      We shall leave the street-by-street analysis to the reader, who can use the links I'll throw in at the end of the article to zoom in on their own house if it suits them.

      Note that you don't need to be in a shaded area to get yourself a quick and sudden Ending. You can have a tree fall on you, have your car washed out in street flooding, step on a downed power line, get purged by looters, enjoy the Robespierre treatment from flying shingles, be summarily executed by National Guardsmen, or even stumble into a sharknado. There's no shortage of ways for you to get Left.

      With that in mind, we now present to you the down-there-somewhere Evacuation Zone map.

      Remember, you don't HAVE to leave when 5-0 tells you to. Also remember that the cop you read the Constitution to before the storm may be the one who has to fish you out of the drink when the ship hits the fan.

      The E-map is easier to read, as it is made up of only two colors.

      Red = Get Out.

      Yellow = Get the f*** out.


      Hurricane Inundation Maps

      Evacuation Maps

      Worst Hurricanes To Hit New England

      List of all hurricanes to hit New England


      0

      Add a comment


    2.  


      Chatham is, if you view Cape Cod as a big fist being shaken towards Europe, the Elbow. Like any other elbow, it's gonna get banged off things now and then. In this case, instead of a table, its a Hurricane.

      There are no imminent storms, Chatham is just next up to bat in our ongoing series.

      We have two maps from FEMA to check out today. The map above is a Hurricane Inundation map, and it depicts storm surge from a direct hit hurricane visiting Chatham at mean high tide. It also shows what sort of storm would be needed to soak certain regions, which we'll get to in a minute.

      The map is from the combined efforts of FEMA, MEMA, NOAA and the NHC. They use the funny-weatherman-titled SLOSH model of storm surge estimation. They do not depict freshwater flooding.

      The colors relate to the Saffir-Simpson scale of hurricane intensity, and break down like this:

      Light Green = Category 1 hurricane. Hurricane Gloria was one of these, and the offshore Halloween Gale was, too. Although not a tropical system, the Blizzard of '78 did Cat. 1-style damage.

      Dark Green = Category 2 hurricane. Hurricane Bob was one of these.

      Yellow = Category 3 hurricane. We've only had five of these hit New England since the Other Man arrived in 1620, the most recent being Hurricane Carol in 1954.

      Pink = Category 4 hurricane. We've had one in recorded New England history, and it struck in 1635.

      Flesh = One Hundred Year FEMA Food Zone. This is the "100 year storm" you hear people speak of, but you have to go pre-Colombian to find them ("going pre-Colombian" means using salt marsh soil samples to look for sand layering associated with large hurricanes). New England has had storms in the Category 4+ level in the 1100s, the 1300s, and the 1400s.

      Sorry about Flesh, but my knowledge of color names was and continues to be heavily influenced by whoever was in charge at Crayola in the 1970s.

      Zoomed out... blurry, but anything unshaded is flooded....
      We shall leave the street-by-street analysis to the reader, who can use the links I'll throw in at the end of the article to zoom in on their own house if it suits them.

      Note that you don't need to be in a shaded area to get yourself a quick and sudden Ending. You can have a tree fall on you, have your car washed out in street flooding, step on a downed power line, get purged by looters, enjoy the Robespierre treatment from flying shingles, be summarily executed by National Guardsmen, or even stumble into a sharknado. There's no shortage of ways for you to get Left.

      With that in mind, we now present to you the down-there-somewhere Evacuation Zone map.

      Remember, you don't HAVE to leave when 5-0 tells you to. Also remember that the cop you read the Constitution to before the storm may be the one who has to fish you out of the drink when the ship hits the fan.

      The E-map is easier to read, as it is made up of only two colors.

      Red = Get Out.

      Yellow = Get the f*** out.


      Hurricane Inundation Maps

      Evacuation Maps

      Worst Hurricanes To Hit New England

      List of all hurricanes to hit New England


      0

      Add a comment


    3.  

      Sandwich is a town with a funny name, even in a state that has a Marblehead and an Athol in it. Sandwich is also a town with gorgeous beaches and marshes, which are awesome for 364 days a year. Those beaches and marshes become a problem when a hurricane comes to town.

      We come to you today to talk about hurricane maps. These maps come from FEMA, MEMA, NOAA and NHC. The map at the top of the page is a Hurricane Inundation Map.

      Here's how it works:

      Light Green = Category 1 hurricane. Hurricane Gloria was one of these, and the offshore Halloween Gale was, too. Although not a tropical system, the Blizzard of '78 did Cat. 1-style damage.

      Dark Green = Category 2 hurricane. Hurricane Bob was one of these.

      Yellow = Category 3 hurricane. We've only had five of these hit New England since the Other Man arrived in 1620, the most recent being Hurricane Carol in 1954.

      Pink = Category 4 hurricane. We've had one in recorded New England history, and it struck in 1635.

      Flesh = One Hundred Year FEMA Food Zone. This is the "100 year storm" you hear people speak of, but you have to go pre-Colombian to find them ("going pre-Colombian" means using salt marsh soil samples to look for sand layering associated with large hurricanes). New England has had storms in the Category 4+ level in the 1100s, the 1300s, and the 1400s.

      Sorry about Flesh, but my knowledge of color names was and continues to be heavily influenced by whoever was in charge at Crayola in the 1970s.

      Yes, that's Duxbury, and yes, that's from a nor'easter and not a hurricane, but it is Inundation.
      "Inundation" is a big word for "storm surge," which are two small words for "saltwater pushed ashore ahead of an incoming cyclone." Feel free to develop more colorful terms like Deathwash or Liquid Doom if that gets your people serious. Flooding is the big killer in hurricanes, sort of what artillery is to warfare.

      This map is based on the zany-weatherman-titled SLOSH model for storm surge inundation. It depicts the inundation that FEMA thinks will occur with a direct-hit hurricane arriving at mean high tide. It does not account for freshwater flooding. It also shows what intensity (on the Saffir-Simpson hurricane intensity scale) of storm would be needed to soak certain parts of Sammich.

      I have written this very same article for every town in SE Massachusetts with a coastline, and many towns are tricky with flooding. Pembroke, which isn't even near the ocean, will get some salt water in a bad enough hurricane. Mattapoisett floods several miles inland, while New Bedford should- in theory- hardly flood at all.

      Sandwich isn't even a little bit tricky. Most of her flooding will occur very close to shore, and you can pretty much guess where it will happen if you take a Sunday drive through town. Granted, someone with my job has looked at a lot of hurricane inundation maps and gets sort of jaded with coastal destruction, but nothing on the Sandwich map makes me say "Damn... who woulda thunk?"

      That's not snow, it's, uhm, stubborn hurricane wave foam...
      Now, don't look at that map, see that your neighborhood isn't colored (FEMA is very egalitarian, and "colored" neighborhoods on FEMA maps are generally populated by less swarthy, waterfront-property-having folks... towns with significant minority populations usually have them in the White neighborhoods), and think that you are off the hook from hurricane damage if one comes up on us. No.

      You can get Ended in an innumerable amount of ways if a hurricane hits Sammich, only a few of which involve saltwater inundation. You could step on a downed power line, get the Charles I treatment from flying debris, drown in pond flooding, have a tree fall on your car, get crucified by purging looters, get swallowed (either up into a cyclone or down into a whirlpool), drown in your attic, suffer summary execution by the National Guard, stumble into a sharknado... trust me, I'm just scratching the surface here, player.

      We want you alive. Beyond base reasoning like "If you actually looked at this article, we cherish you and cannot fiscally afford to lose your potential site visits," we also have a sort of "If they utilized the article properly, they live" professional pride thing going on. We also want you alive for regular, nice-person reasons. You're our kind of people.

      This leads into our next map, the Evacuation Zone map. This one is much less nuanced than the Inundation map, in that there are only two colors.

      They basically break down to:

      Pink = These people should leave.

      Yellow = You should leave, too.


      Here are a few things that my highly trained eye sees with these here maps of ours:

      - Storms will be very, very capable of washing out Route 6A in some spots. This makes Scorton Neck into an island.

      - Add that to "the bridges close when the winds top 70 mph or so," and you have a Trapped Sandwich.

      - Marylou's of Sandwich is vulnerable to Category 4 storms, a problem I expect them to have solved before the next Category 4 storm hits. I need Marylou's, as I don't like Red Bull and this site doesn't make enough for me to afford cocaine.

      - The Sandwich fire and police stations are vulnerable to even a minimal hurricane.

      - You're safe off Route 130, and I'd encourage coastal people to befriend someone off 130 well enough to be granted asylum from the storm.

      - Even a minor hurricane will at least temporarily end Sandwich's above-water presence on the mainland.

      - The Canal would only spill over in Category 3 and above.

      - The power plant is safe from flooding in all but the worst storms, according to FEMA.

      - Ridiculous shoreline change is likely, with much sand loss into the marshes. Thanks to the Canal jetty and certain legislative failures, no replenishing sand will be forthcoming.

      - We'll leave the street-by-street analysis to the reader. You can use the maps on the site to zoom in to your very home. We'll link you up at the end of the article, no worries.

      - Seek out and question whichever old-timer has lived in your neighborhood the longest. Ask him or her what happened in Hurricane Carol. Find out how bad the road flooded, what happened to your house, how impossible escape was, and all that. You should never fail to utilize the Old School when planning your personal emergency response.


      Bone up on the Hurricane Information with these handy links:

      Hurricane Inundation Maps

      Evacuation Maps

      Worst Hurricanes To Hit New England

      List of all hurricanes to hit New England


      Sandwich Flood Mitigation Plan

      (pictures by FEMA, Stacey Moreau and Carter Malpass)
      0

      Add a comment


    4.  


      9/20 1:00 ET At Carolina -3 Houston 39.5

      MC Mallett (comes in at 0:25) takes over in Texas, with predictable results.

      Carolina, 20-10


      9/20 1:00 ET At New Orleans -9.5 Tampa Bay 47

      Tampa had about 40 points put up on them by the QB they passed over in the draft to get a guy named Jameis.

      NO, 41-14


      9/20 1:00 ET At Pittsburgh -6.5 San Francisco 45.5

      San Francsco ran right over Minnesota, which is sort of disppointing because I went to (Teddy) Bridgewater State University and want to get one of his jerseys instead of the uglier BSU one. I don't want to get his jersey if he's inept.

      Pittsburgh, 28-20


      9/20 1:00 ET At Minnesota -2 Detroit 43.5

      I already used my BSU line, so we'll just point out here that the last RB to play Minny ran for 160 yards and 2 TDs. I'm sure that Detroit has factored this into the old game plan.

      Detroit, 24-21


      9/20 1:00 ET At Buffalo  PK New England 44.5

      Not related, but the last Pick 'Em tip I got for a game ended with me watching Bourne go down 42-0 last Friday. Fortunately, I don't bet on high school football any more... very often.... in large sums.

      New England 24-21


      9/20 1:00 ET Arizona -2 At Chicago 46

      I like Chicago for absolutely no logical reason at all.

      Chicago, 21-17


      9/20 1:00 ET Tennessee -1.5 At Cleveland 41.5

      Everyone hates Johnny Football, but I'm rooting for him. I want him to win without giving up his evil ways. "Weird heroes and mould-breaking champions exist as living proof to those who need it that the tyranny of 'the rat race' is not yet final.”

      Cleveland, 24-18


      9/20 1:00 ET At Cincinnati -3 San Diego 47

      I've been writing about the NFL for 12 years now, an I still have to double-check when I spell "Cincinnati." Just did it right there, you see. I also can not memorize the spelling of "Apponequet," but that only matters when I write the high school columns.

      Cincy, 28-24


      9/20 1:00 ET St. Louis -3 At Washington 41

      The last time these two teams played, the Rams sent out every guy they got in the RGIII trade for the coin flip. It was like 8 guys. RGIII's job this week is to make sure that no one steals the bench by holding it down with his ass.

      St. Louis, 24-3


      9/20 1:00 ET At NY Giants -2.5 Atlanta 51

      The best pass rusher in NY has like 2 fingers on his dominant hand, so what's not to like?

      Atlanta, 31-24


      9/20 4:05 ET Baltimore -6.5 At Oakland 43

      I want a cigarette every time I say "Joe Flacco" for some reason.

      Baltimore, 30-10


      9/20 4:05 ET Miami -5.5 At Jacksonville 41.5

      Only warriors in the Amazon- none of whom I can contact, and none of whom follow the NFL- can tell you if a Dolphin or a Jaguar would win in a fight. Unrelated: Why doesn't the car company pay Jacksonville to use their car logo on the football helmet?

      Miami, 24-14


      9/20 4:25 ET At Philadelphia -5 Dallas 55

      Dez breaking his foot doomed like 5 of my fantasy teams in Week 1.

      Philly, 35-21


      9/20 8:30 ET At Green Bay -3.5 Seattle 49

      Jordy Nelson doomed the other 5.

      Seattle, 20-19


      Monday Night Football Line
      9/21 8:30 ET At Indianapolis -7 NY Jets 47

      Indy looked butter-soft last week, but NY looks weak pretty much all the time.

      Indy, 31-20


      FANTASY

      We took an L last week, although it would have been closer if DeSean Jackson didn't tap out of the game after one friggin play. Our other WRs combined to score 5 points. Those same guys are starting this week, because Alshon Jeffery is taking the day off as well. Andre Johnson will be on Revis Island, too. We do have Chris Johnson, unemployed a few months ago, rising up into the flex spot.

      CJ2K is a gut call, as my other options are Bishop Sankey (may have had his one good game of the year already) aand LeGarrette Blount (first game back after suspension).

      I'm up 20-11, as my defense put up 20 on KC, while his WR1 (Thomas) got 11 points.

      Magnanimous Sunni Chieftans

      QB Andrew Luck
      RB Marshawn Lynch
      RB Joseph Randle
      WR Andre Johnson
      WR Anquan Bolden
      TE Duane Allen
      FX Chris Johnson
      D/S Denver Broncos
      K Steven Hauschka

      Our honorable opponents, Deez Nutzzzz:

      QB Russell Wilson
      RB Adrian Peterson
      RB Alfred Morris
      WR Demaryius Thomas
      WR Brandon Marshall
      TE Greg Olsen
      FX DeAngelo Williams
      D/S Houston Texans
      K Stephen Gostkowski

      0

      Add a comment


    5.  


      Barnstable is in a position not unlike that which Germany faced in the World Wars. They have a two front battle going on if a hurricane arrives.

      We have two maps from FEMA to check out today. The map above is a Hurricane Inundation map, and it depicts storm surge from a direct hit hurricane visiting Barnstable at mean high tide. It also shows what sort of storm would be needed to soak certain regions, which we'll get to in a minute.

      The map is from the combined efforts of FEMA, MEMA, NOAA and the NHC. They use the funny-weatherman-titled SLOSH model of storm surge estimation. They do not depict freshwater flooding.

      The colors relate to the Saffir-Simpson scale of hurricane intensity, and break down like this:

      Light Green = Category 1 hurricane. Hurricane Gloria was one of these, and the offshore Halloween Gale was, too. Although not a tropical system, the Blizzard of '78 did Cat. 1-style damage.

      Dark Green = Category 2 hurricane. Hurricane Bob was one of these.

      Yellow = Category 3 hurricane. We've only had five of these hit New England since the Other Man arrived in 1620, the most recent being Hurricane Carol in 1954.

      Pink = Category 4 hurricane. We've had one in recorded New England history, and it struck in 1635.

      Flesh = One Hundred Year FEMA Food Zone. This is the "100 year storm" you hear people speak of, but you have to go pre-Colombian to find them ("going pre-Colombian" means using salt marsh soil samples to look for sand layering associated with large hurricanes). New England has had storms in the Category 4+ level in the 1100s, the 1300s, and the 1400s.

      Sorry about Flesh, but my knowledge of color names was and continues to be heavily influenced by whoever was in charge at Crayola in the 1970s.


      We shall leave the street-by-street analysis to the reader, who can use the links I'll throw in at the end of the article to zoom in on their own house if it suits them.

      Note that you don't need to be in a shaded area to get yourself a quick and sudden Ending. You can have a tree fall on you, have your car washed out in street flooding, step on a downed power line, get purged by looters, enjoy the Robespierre treatment from flying shingles, be summarily executed by National Guardsmen, or even stumble into a sharknado. There's no shortage of ways for you to get Left.

      With that in mind, we now present to you the down-there-somewhere Evacuation Zone map.

      Remember, you don't HAVE to leave when 5-0 tells you to. Also remember that the cop you read the Constitution to before the storm may be the one who has to fish you out of the drink when the ship hits the fan.

      The E-map is easier to read, as it is made up of only two colors.

      Red = Get Out.

      Yellow = Get the f*** out.

      Notice that Route 28 washes out in a few spots.

      It's a big town, we break the maps down a bit to make it easier for you

      Egad! The Hyannis Port Compound could get soaked!


      Hurricane Inundation Maps

      Evacuation Maps

      Worst Hurricanes To Hit New England

      List of all hurricanes to hit New England


      0

      Add a comment


    6.  

      Red skies at night...

      ...quarter mile visibility in the morning.

      Our fog fights their sun and almost wins...

      Cranberry Highway, heading towards the Seafood Shanty and Barlow's

      Fishing for some fog...


      0

      Add a comment

    Loading