Showing posts with label nantucket sound. Show all posts

Thursday, April 7, 2016

South Coast-al Flooding Tonight, Snow Saturday Night?


It sure has been a wild weather week, and it will only get worse as we head through the weekend.

Remember, it snowed earlier this week. That was an April snow, and it was a top 20 event for April snow in some locales. We then ad our temperatures plunge, which also approached some records. After that, the wind kicked in.

I'm watching a tree in my neighbor's yard, and it looks 50/50 on toppling. I'm sort of East of it, and it looks like it will topple North. If this column ends suddenly on, that's probably what happened.

We have a Gale Warning for the ships at sea, and a Wind Advisory for the landlubbers. Winds will gust from the S/SW near 50 MPH today through about 9 PM or so. This wind could take down some tree limbs and cause isolated power outages. It would be worse if there was snow, but we'll get to snow in a moment.

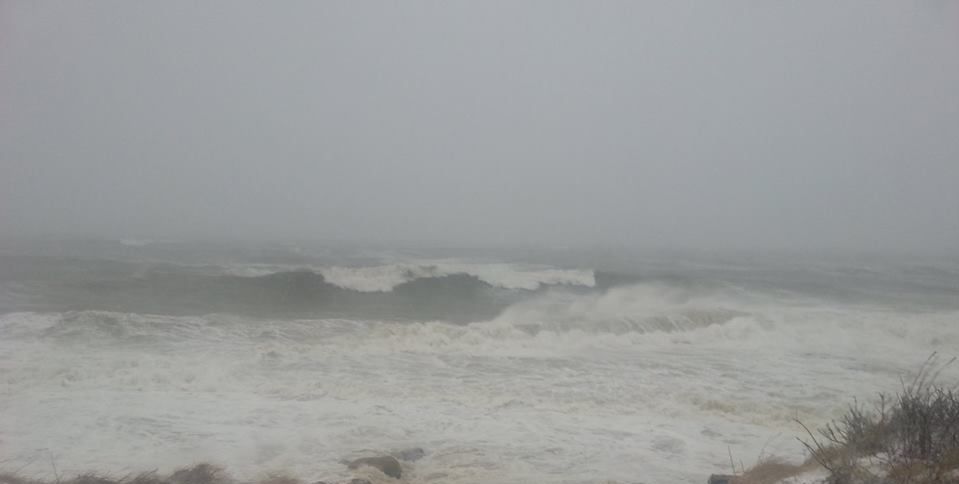
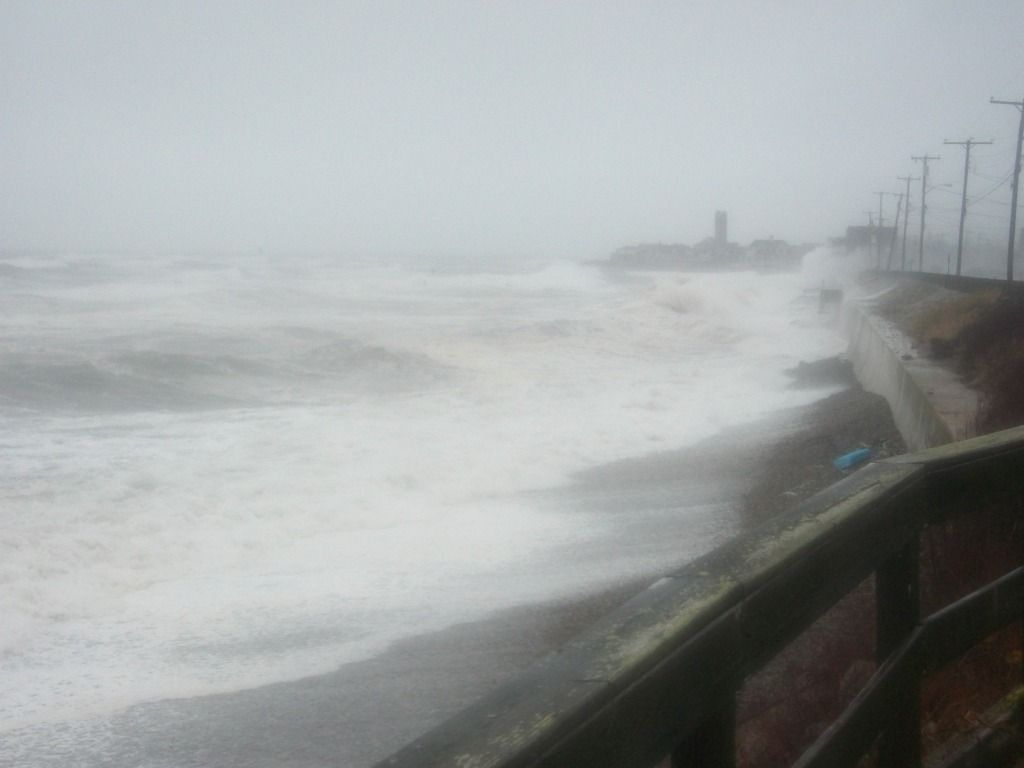
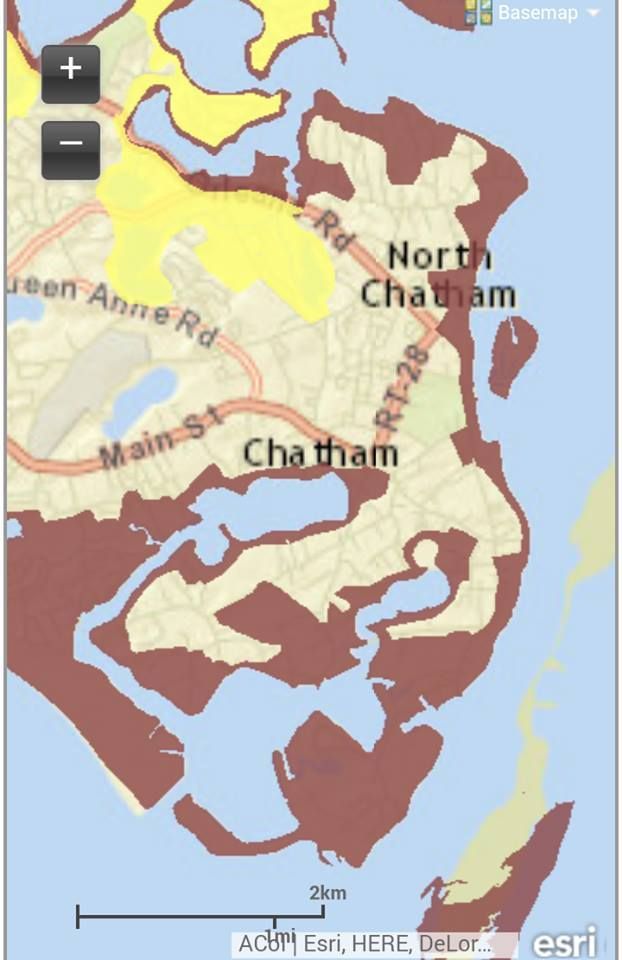
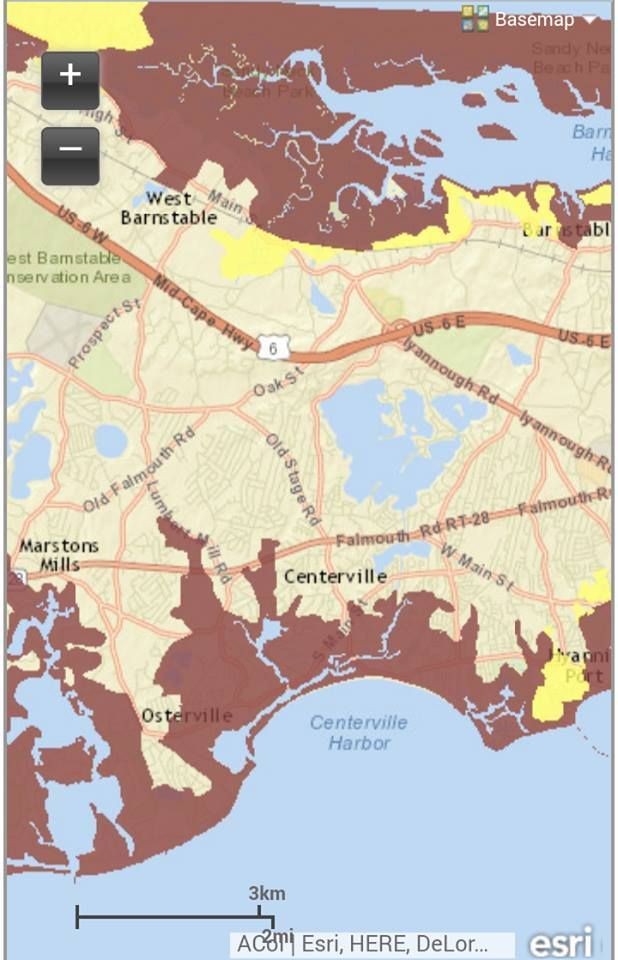
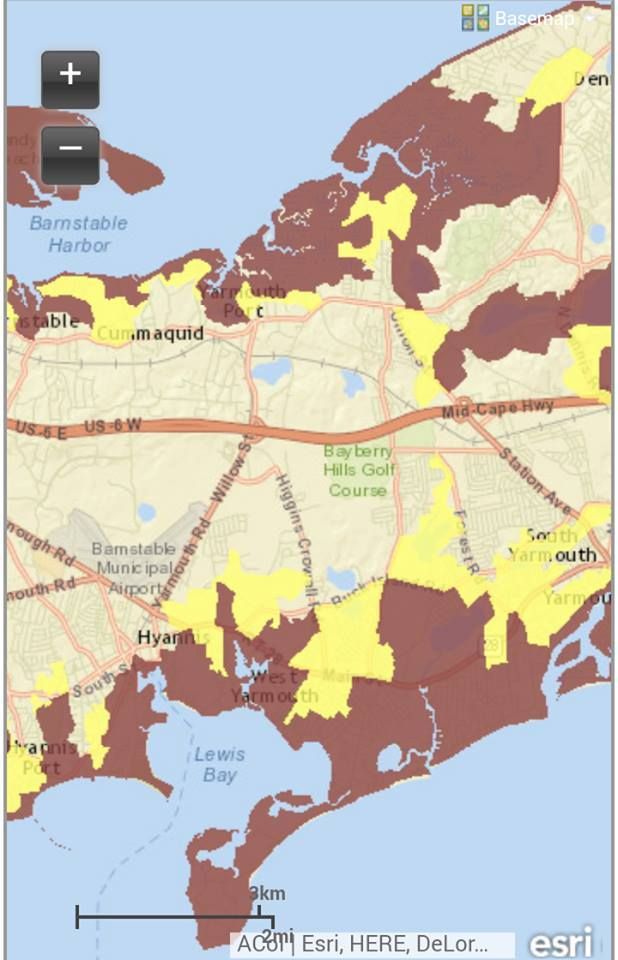
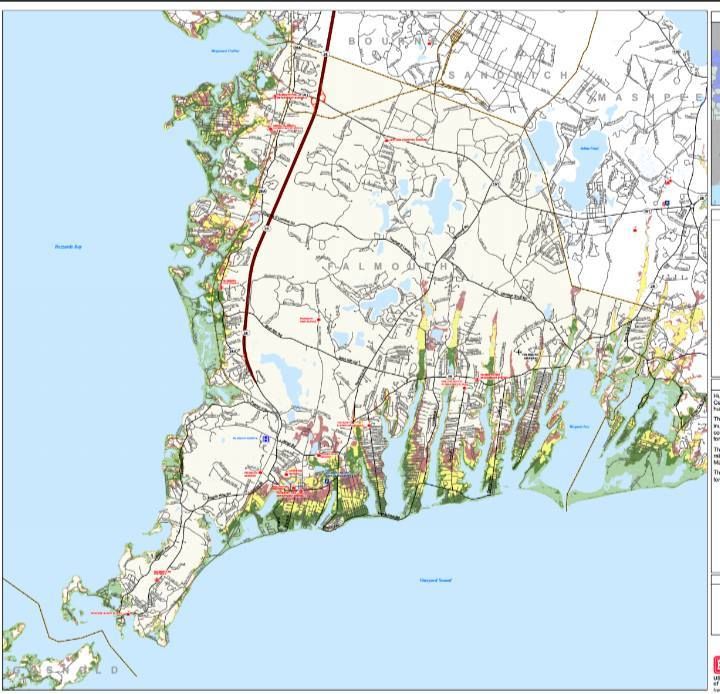
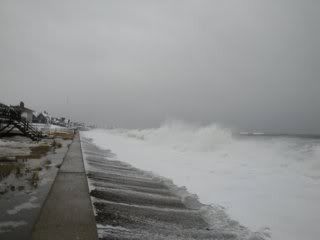
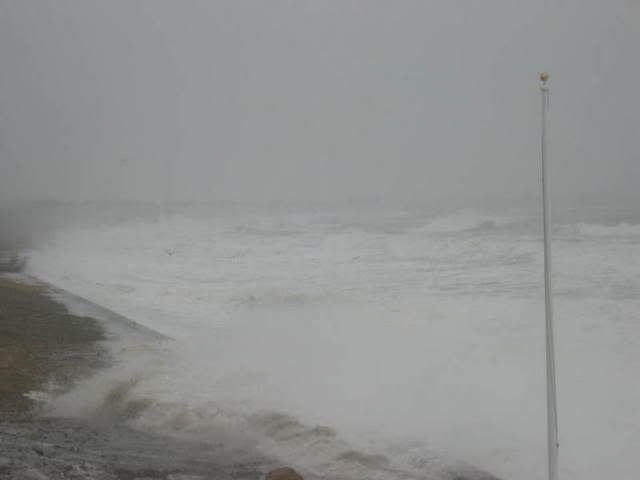
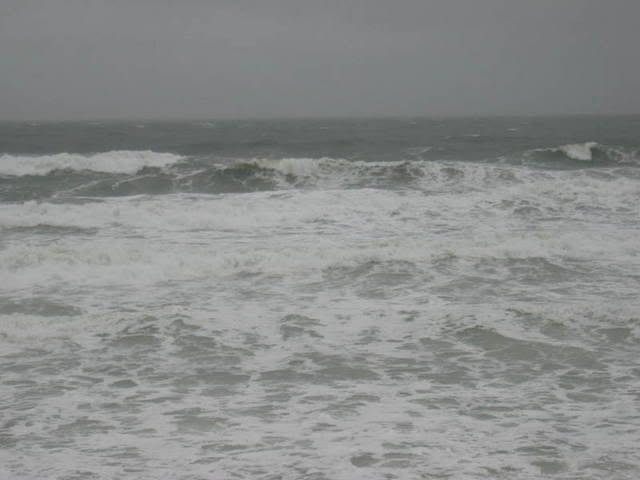
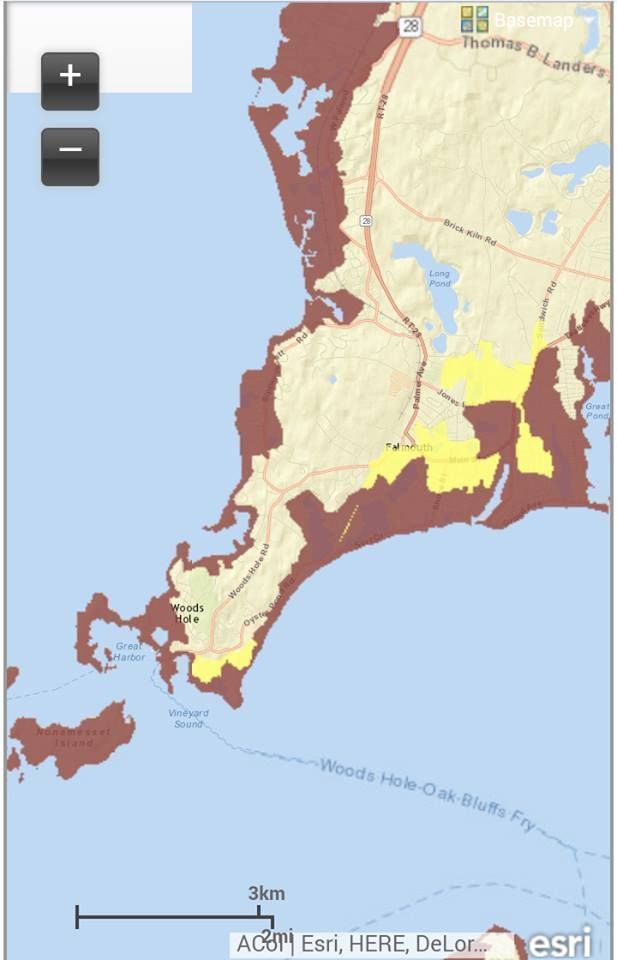
We also have a Coastal Flood Advisory for south-facing beaches and the people who love them. High tides will be between 8:30 and 9:30 for most spots. This is the spring new moon tide, always trouble for anyone on the coast, especially if there is a big wind.

Minor to moderate coastal flooding is possible, as the winds are really making the seas angry, my friend. This flooding won't knock down your house, but it can still cause all sorts of trouble. a 2 foot storm surge is possible, thanks to Wendy Gust.

As always, we do try to remind coastal residents in our coverage area to never do yard work until (at the earliest) late April. Having to hustle to get the yard ready for Mother's Day or Memorial Day sucks, but it's harder to do the job twice when we get one of those Ides Of April storms.


After that, we get a night's rest, and then we can start worrying about the snow that may be coming Saturday night. One of those Alberta Clipper things will streak south of us, and her northern fringe may put us in the powder on April friggin' 9th.

It may start as rain, but it should turn to snow as the storm pulls away from 'Murica and the cold air piles in behind it. We could be in the 20s overnight Saturday.

Opening Day at ol' Fenway is Monday. The Boston Marathon is a week from Monday.

This won't be a snowstorm that buries you to the point where somebody has to go get a St. Bernard dog. It would most likely be a coating to an inch, and that indeterminate total will mostly fall south of Boston.

The snow, should we get it, would be notable more for her timing than her ferocity. We're taking April 9th into April 10th, folks. Wishing for a beach day, getting a snow day.... ayup.

Here's a forecast map of the Clipper going off the coast on Saturday, with most of MA already getting snow:

Tuesday, September 29, 2015

Master List, Hurricane Information By Town


This is a list of every town that we did a Hurricane Information Special for.

Don't say, "Wow, I love this author, I'm going to read every single one." I did a lot of cut-n-paste, and, towards the end, I just pasted whole articles and would just change the maps and the town name. Hey, it's October in a few days, and a Tropical Storm is bearing down on us... I had to hurry.

I also recycled a few jokes, for the same reason.

Either way, the maps are what is important,and each article has two very important maps for the town listed.

Be safe, stay informed, and visit our sponsors...

Duxbury

Boston

Brewster

Somerset

Swansea

Hingham

Weymouth

Quincy

Fall River

Mashpee

Orleans

Harwich

Westport

Wellfleet

Dennis

Yarmouth

Chatham

Sandwich

Barnstable

Falmouth

Marion

Scituate

New Bedford

Hull

Eastham

Fairhaven

Dartmouth

Marshfield

Plymouth

Mattapoisett

Cohasset

Truro

Kingston

Freetown

Wareham

Bourne

Bourne II


Mashpee Hurricane Planner


We have two maps from FEMA to check out today. The map above is a Hurricane Inundation map, and it depicts storm surge from a direct hit hurricane visiting Mashpee at mean high tide. It also shows what sort of storm would be needed to soak certain regions, which we'll get to in a minute.

The map is from the combined efforts of FEMA, MEMA, NOAA and the NHC. They use the funny-weatherman-titled SLOSH model of storm surge estimation. They do not depict freshwater flooding.

The colors relate to the Saffir-Simpson scale of hurricane intensity, and break down like this:

Light Green = Category 1 hurricane. Hurricane Gloria was one of these, and the offshore Halloween Gale was, too. Although not a tropical system, the Blizzard of '78 did Cat. 1-style damage.

Dark Green = Category 2 hurricane. Hurricane Bob was one of these.

Yellow = Category 3 hurricane. We've only had five of these hit New England since the Other Man arrived in 1620, the most recent being Hurricane Carol in 1954.

Pink = Category 4 hurricane. We've had one in recorded New England history, and it struck in 1635.

Flesh = One Hundred Year FEMA Food Zone. This is the "100 year storm" you hear people speak of, but you have to go pre-Colombian to find them ("going pre-Colombian" means using salt marsh soil samples to look for sand layering associated with large hurricanes). New England has had storms in the Category 4+ level in the 1100s, the 1300s, and the 1400s.

Sorry about Flesh, but my knowledge of color names was and continues to be heavily influenced by whoever was in charge at Crayola in the 1970s.

We shall leave the street-by-street analysis to the reader, who can use the links I'll throw in at the end of the article to zoom in on their own house if it suits them.

Note that you don't need to be in a shaded area to get yourself a quick and sudden Ending. You can have a tree fall on you, have your car washed out in street flooding, step on a downed power line, get purged by looters, enjoy the Robespierre treatment from flying shingles, be summarily executed by National Guardsmen, or even stumble into a sharknado. There's no shortage of ways for you to get Left.

With that in mind, we now present to you the down-there-somewhere Evacuation Zone map.

Remember, you don't HAVE to leave when 5-0 tells you to. Also remember that the cop you read the Constitution to before the storm may be the one who has to fish you out of the drink when the ship hits the fan.

The E-map is easier to read, as it is made up of only two colors.

Red = Get Out.

Yellow = Get the f*** out.


Harwich Hurricane Planner


We have two maps from FEMA to check out today. The map above is a Hurricane Inundation map, and it depicts storm surge from a direct hit hurricane visiting Harwich at mean high tide. It also shows what sort of storm would be needed to soak certain regions, which we'll get to in a minute.

The map is from the combined efforts of FEMA, MEMA, NOAA and the NHC. They use the funny-weatherman-titled SLOSH model of storm surge estimation. They do not depict freshwater flooding.

The colors relate to the Saffir-Simpson scale of hurricane intensity, and break down like this:

Light Green = Category 1 hurricane. Hurricane Gloria was one of these, and the offshore Halloween Gale was, too. Although not a tropical system, the Blizzard of '78 did Cat. 1-style damage.

Dark Green = Category 2 hurricane. Hurricane Bob was one of these.

Yellow = Category 3 hurricane. We've only had five of these hit New England since the Other Man arrived in 1620, the most recent being Hurricane Carol in 1954.

Pink = Category 4 hurricane. We've had one in recorded New England history, and it struck in 1635.

Flesh = One Hundred Year FEMA Food Zone. This is the "100 year storm" you hear people speak of, but you have to go pre-Colombian to find them ("going pre-Colombian" means using salt marsh soil samples to look for sand layering associated with large hurricanes). New England has had storms in the Category 4+ level in the 1100s, the 1300s, and the 1400s.

Sorry about Flesh, but my knowledge of color names was and continues to be heavily influenced by whoever was in charge at Crayola in the 1970s.

We shall leave the street-by-street analysis to the reader, who can use the links I'll throw in at the end of the article to zoom in on their own house if it suits them.

Note that you don't need to be in a shaded area to get yourself a quick and sudden Ending. You can have a tree fall on you, have your car washed out in street flooding, step on a downed power line, get purged by looters, enjoy the Robespierre treatment from flying shingles, be summarily executed by National Guardsmen, or even stumble into a sharknado. There's no shortage of ways for you to get Left.

With that in mind, we now present to you the down-there-somewhere Evacuation Zone map.

Remember, you don't HAVE to leave when 5-0 tells you to. Also remember that the cop you read the Constitution to before the storm may be the one who has to fish you out of the drink when the ship hits the fan.

The E-map is easier to read, as it is made up of only two colors.

Red = Get Out.

Yellow = Get the f*** out.


Hurricane Inundation Maps

Evacuation Maps

Worst Hurricanes To Hit New England

List of all hurricanes to hit New England

Monday, September 28, 2015

Well, What's This...?

Tropical Storm Joaquin To Hit New England?


We're keeping en eye on a system in the western Atlantic. 

Several forecasting models run it up the coast at us as a tropical depression or a weak tropical storm. The official NHC forecast takes it out to sea without it impacting any land masses. As it moves closer to us, it will meet some shear and some less-than-bathwater sea temperatures, and that will lessen her impact.

If it did become a tropical storm, and if nothing else forms in the Atlantic before it does, it will be Joaquin. If Joaquin happens somewhere else (and I hope it does, I pronounce Joaquin poorly), our storm would be Kate.

This isn't Katrina or anything, so don't panic. It could rain like hell, and there may be some minor-to-moderate coastal flooding at the beaches. It could also get very breezy. As with any storm, the forecast could change wildly in 12 hours, so keep yourself updated.

We'll have the whole CCM team mobilized if any cool pictures come out of it.


Monday, September 21, 2015

Dennis-Yarmouth Hurricane Information


There are no imminent storms, Dennis-Yarmouth are just next up to bat in our ongoing series.

We have two maps from FEMA to check out today. The map above is a Hurricane Inundation map, and it depicts storm surge from a direct hit hurricane visiting D-Y at mean high tide. It also shows what sort of storm would be needed to soak certain regions, which we'll get to in a minute.

The map is from the combined efforts of FEMA, MEMA, NOAA and the NHC. They use the funny-weatherman-titled SLOSH model of storm surge estimation. They do not depict freshwater flooding.

The colors relate to the Saffir-Simpson scale of hurricane intensity, and break down like this:

Light Green = Category 1 hurricane. Hurricane Gloria was one of these, and the offshore Halloween Gale was, too. Although not a tropical system, the Blizzard of '78 did Cat. 1-style damage.

Dark Green = Category 2 hurricane. Hurricane Bob was one of these.

Yellow = Category 3 hurricane. We've only had five of these hit New England since the Other Man arrived in 1620, the most recent being Hurricane Carol in 1954.

Pink = Category 4 hurricane. We've had one in recorded New England history, and it struck in 1635.

Flesh = One Hundred Year FEMA Food Zone. This is the "100 year storm" you hear people speak of, but you have to go pre-Colombian to find them ("going pre-Colombian" means using salt marsh soil samples to look for sand layering associated with large hurricanes). New England has had storms in the Category 4+ level in the 1100s, the 1300s, and the 1400s.

Sorry about Flesh, but my knowledge of color names was and continues to be heavily influenced by whoever was in charge at Crayola in the 1970s.

We shall leave the street-by-street analysis to the reader, who can use the links I'll throw in at the end of the article to zoom in on their own house if it suits them.

Note that you don't need to be in a shaded area to get yourself a quick and sudden Ending. You can have a tree fall on you, have your car washed out in street flooding, step on a downed power line, get purged by looters, enjoy the Robespierre treatment from flying shingles, be summarily executed by National Guardsmen, or even stumble into a sharknado. There's no shortage of ways for you to get Left.

With that in mind, we now present to you the down-there-somewhere Evacuation Zone map.

Remember, you don't HAVE to leave when 5-0 tells you to. Also remember that the cop you read the Constitution to before the storm may be the one who has to fish you out of the drink when the ship hits the fan.

The E-map is easier to read, as it is made up of only two colors.

Red = Get Out.

Yellow = Get the f*** out.


Hurricane Inundation Maps

Evacuation Maps

Worst Hurricanes To Hit New England

List of all hurricanes to hit New England


Chatham Hurricane Special


Chatham is, if you view Cape Cod as a big fist being shaken towards Europe, the Elbow. Like any other elbow, it's gonna get banged off things now and then. In this case, instead of a table, its a Hurricane.

There are no imminent storms, Chatham is just next up to bat in our ongoing series.

We have two maps from FEMA to check out today. The map above is a Hurricane Inundation map, and it depicts storm surge from a direct hit hurricane visiting Chatham at mean high tide. It also shows what sort of storm would be needed to soak certain regions, which we'll get to in a minute.

The map is from the combined efforts of FEMA, MEMA, NOAA and the NHC. They use the funny-weatherman-titled SLOSH model of storm surge estimation. They do not depict freshwater flooding.

The colors relate to the Saffir-Simpson scale of hurricane intensity, and break down like this:

Light Green = Category 1 hurricane. Hurricane Gloria was one of these, and the offshore Halloween Gale was, too. Although not a tropical system, the Blizzard of '78 did Cat. 1-style damage.

Dark Green = Category 2 hurricane. Hurricane Bob was one of these.

Yellow = Category 3 hurricane. We've only had five of these hit New England since the Other Man arrived in 1620, the most recent being Hurricane Carol in 1954.

Pink = Category 4 hurricane. We've had one in recorded New England history, and it struck in 1635.

Flesh = One Hundred Year FEMA Food Zone. This is the "100 year storm" you hear people speak of, but you have to go pre-Colombian to find them ("going pre-Colombian" means using salt marsh soil samples to look for sand layering associated with large hurricanes). New England has had storms in the Category 4+ level in the 1100s, the 1300s, and the 1400s.

Sorry about Flesh, but my knowledge of color names was and continues to be heavily influenced by whoever was in charge at Crayola in the 1970s.

Zoomed out... blurry, but anything unshaded is flooded....
We shall leave the street-by-street analysis to the reader, who can use the links I'll throw in at the end of the article to zoom in on their own house if it suits them.

Note that you don't need to be in a shaded area to get yourself a quick and sudden Ending. You can have a tree fall on you, have your car washed out in street flooding, step on a downed power line, get purged by looters, enjoy the Robespierre treatment from flying shingles, be summarily executed by National Guardsmen, or even stumble into a sharknado. There's no shortage of ways for you to get Left.

With that in mind, we now present to you the down-there-somewhere Evacuation Zone map.

Remember, you don't HAVE to leave when 5-0 tells you to. Also remember that the cop you read the Constitution to before the storm may be the one who has to fish you out of the drink when the ship hits the fan.

The E-map is easier to read, as it is made up of only two colors.

Red = Get Out.

Yellow = Get the f*** out.


Hurricane Inundation Maps

Evacuation Maps

Worst Hurricanes To Hit New England

List of all hurricanes to hit New England


Saturday, September 19, 2015

Barnstable Hurricane Information


Barnstable is in a position not unlike that which Germany faced in the World Wars. They have a two front battle going on if a hurricane arrives.

We have two maps from FEMA to check out today. The map above is a Hurricane Inundation map, and it depicts storm surge from a direct hit hurricane visiting Barnstable at mean high tide. It also shows what sort of storm would be needed to soak certain regions, which we'll get to in a minute.

The map is from the combined efforts of FEMA, MEMA, NOAA and the NHC. They use the funny-weatherman-titled SLOSH model of storm surge estimation. They do not depict freshwater flooding.

The colors relate to the Saffir-Simpson scale of hurricane intensity, and break down like this:

Light Green = Category 1 hurricane. Hurricane Gloria was one of these, and the offshore Halloween Gale was, too. Although not a tropical system, the Blizzard of '78 did Cat. 1-style damage.

Dark Green = Category 2 hurricane. Hurricane Bob was one of these.

Yellow = Category 3 hurricane. We've only had five of these hit New England since the Other Man arrived in 1620, the most recent being Hurricane Carol in 1954.

Pink = Category 4 hurricane. We've had one in recorded New England history, and it struck in 1635.

Flesh = One Hundred Year FEMA Food Zone. This is the "100 year storm" you hear people speak of, but you have to go pre-Colombian to find them ("going pre-Colombian" means using salt marsh soil samples to look for sand layering associated with large hurricanes). New England has had storms in the Category 4+ level in the 1100s, the 1300s, and the 1400s.

Sorry about Flesh, but my knowledge of color names was and continues to be heavily influenced by whoever was in charge at Crayola in the 1970s.


We shall leave the street-by-street analysis to the reader, who can use the links I'll throw in at the end of the article to zoom in on their own house if it suits them.

Note that you don't need to be in a shaded area to get yourself a quick and sudden Ending. You can have a tree fall on you, have your car washed out in street flooding, step on a downed power line, get purged by looters, enjoy the Robespierre treatment from flying shingles, be summarily executed by National Guardsmen, or even stumble into a sharknado. There's no shortage of ways for you to get Left.

With that in mind, we now present to you the down-there-somewhere Evacuation Zone map.

Remember, you don't HAVE to leave when 5-0 tells you to. Also remember that the cop you read the Constitution to before the storm may be the one who has to fish you out of the drink when the ship hits the fan.

The E-map is easier to read, as it is made up of only two colors.

Red = Get Out.

Yellow = Get the f*** out.

Notice that Route 28 washes out in a few spots.

It's a big town, we break the maps down a bit to make it easier for you

Egad! The Hyannis Port Compound could get soaked!


Hurricane Inundation Maps

Evacuation Maps

Worst Hurricanes To Hit New England

List of all hurricanes to hit New England


Thursday, September 17, 2015

Falmouth Hurricane Information Special


Falmouth holds a corner lot on Cape Cod, facing both Buzzards Bay and Nantucket Sound. You never want to have multiple county-sized bodies of water looking to push ashore into your town when a storm comes, which leads us to today's topic of discussion.

We have two maps for you to analyze with your friends and family. The map above is a Hurricane Inundation Map. It comes from FEMA, MEMA, NOAA and NHC, will be written about by ME, and read by U.

"Inundation" is a fancy word for "storm surge," which are two fancy words for "water pushed ashore by a storm." This is the killer in a storm, it's what did in New Orleans 10 years ago, and the maps give you several views of it.

You can see where water will come ashore in a direct hit hurricane arriving at high tide, and you'll see what degree of storm (via the Saffir-Simpson hurricane intensity scale) will flood different parts of town. They are based on the zany-weatherman-titled SLOSH model of storm surge inundation.

These maps do not project freshwater flooding things like rain, overflowing rivers and sewer backups, as well as people just spraying the hose into the street for the hell of it, mid-storm, because Falmouth is a hardcore sort of town.


Light Green = Category 1 hurricane. The Blizzard of '78 and the Halloween Gale are good examples of Category 1 storm damage, although neither was directly a hurricane. If those didn't hit hard down there (I'm a Duxbury kid, and was on Duxbury Beach for '78 and '91), use Hurricane Gloria as a hits-at-low-tide benchmark.

Dark Green = Category 2 hurricane. Hurricane Bob was a weak Category 2, and yes we do realize that "weak" and "Category 2 hurricane" are odd words to chain together.

Yellow = Category 3 hurricane. We've only had five storms of this strength hit New England since the Other Man arrived in 1620, the most recent being Carol in 1954.

Pink = Category 4 hurricane. We've had one in recorded history, in 1635.

Flesh = 100 Year FEMA Flood Zone. This is the "hundred year storm" you hear about, although you have to go pre-Colombian to find them. New England was hit by storms greater than Category 4 in roughly 1100 AD, 1300 AD and 1400 AD. They can tell by checking layers of sand on salt marsh muck.

Sorry about "flesh," my knowledge of colors was greatly dictated by the people at Crayola in the 1970s.


You can check these maps in far greater detail by going here and zooming a bit. It's disaster porn, styled to your very home!

Again, these maps do not depict freshwater flooding, and freshwater flooding will cause a whole slew of problems on her own if a hurricane says "Wuzzup?" to Wood's Hole.

Remember, you don't have to get flooded with seawater to die in a hurricane. You can get hit by lightning, sucked into a river, mashed in a road accident, have a tree fall on you, step on power lines, stumble into a sharknado or be killed by looters.

These maps show you what dangers face your particular house, and you can use them to decide on whether to make a run for it or not.


We'd also advise you to chat up the oldest guy with the longest residency in your neighborhood. Find out what Carol did to the house you live in now. Find out how high the water was in the street, how long the power was out for, what roads become impassable, and any other k-nuggets of knowledge the old fella might have.

Cranberry County Magazine stands strong behind our philosophy that your hurricane preparation planning is incomplete until you talk to some white heads. Your neighborhood's Old School is an asset which should not be underutilized.

FEMA and GRAMPS may hold differing opinions as to when you should flee, but FEMA most likely wasn't living on your street in 1954 when Carol came ashore. Gramps was. If he says your street floods and FEMA doesn't (my own neighborhood floods in nor'easters, but FEMA gives it Category 4 status), you may want to do some serious merit-weighing when deciding if you should Get To Steppin'.

This leads to our second map style, the Evacuation Map,

This is the map the authorities use when determining which neighborhoods will be evacuated. You don't HAVE to leave when the police tell you, but you also want to remember that the cop you were reading the Constitution to before the storm might very well be the one who has to make a decision as to whether or not to dive in to the maelstrom after you and your family.

I'm not chastising you. I watched the Halloween Gale from a waterfront home, with the police on a nearby hill blasting a searchlight on us the whole time.

Of course, that was a stupid move, so we'll work the other side now, and tell you about Feets Don't Fail Me Now, Heading For The Hills, and Running Like A Scaled Dog.

This map is easier to follow. It has two colors:

Pink = They have to evacuate.

Yellow = You do, too.

Here's the Evacuation Zone map:


Hurricane Inundation Maps

Evacuation Maps

Worst Hurricanes To Hit New England

List of all hurricanes to hit New England