Chatham is, if you view Cape Cod as a big fist being shaken towards Europe, the Elbow. Like any other elbow, it's gonna get banged off things now and then. In this case, instead of a table, its a Hurricane.
There are no imminent storms, Chatham is just next up to bat in our ongoing series.
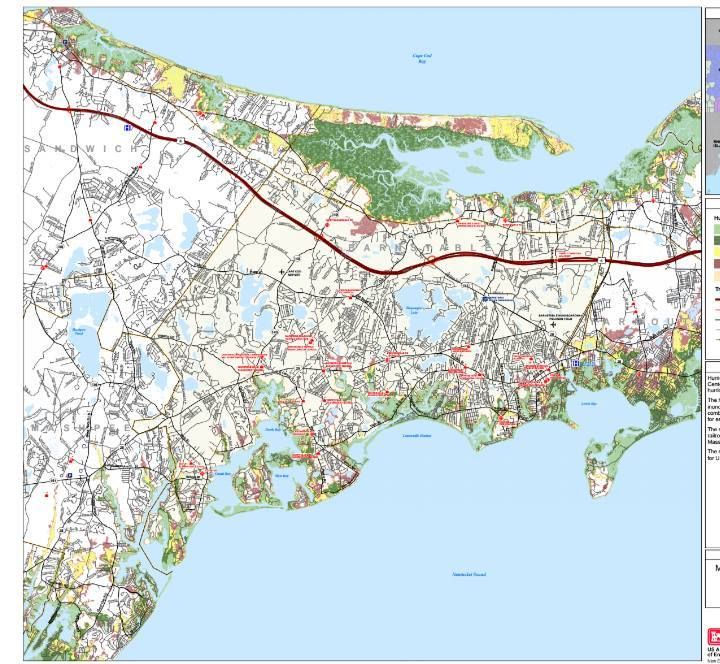
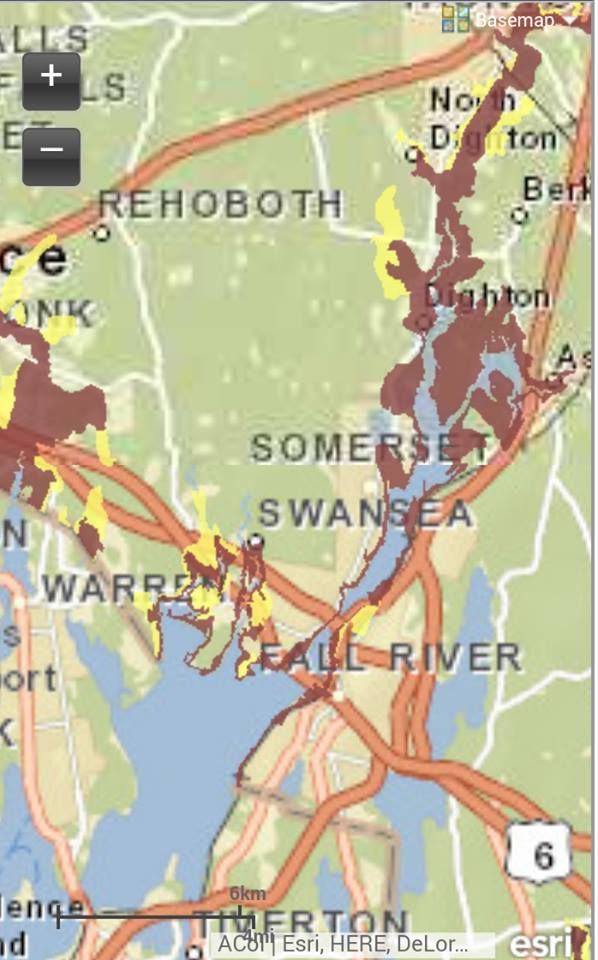
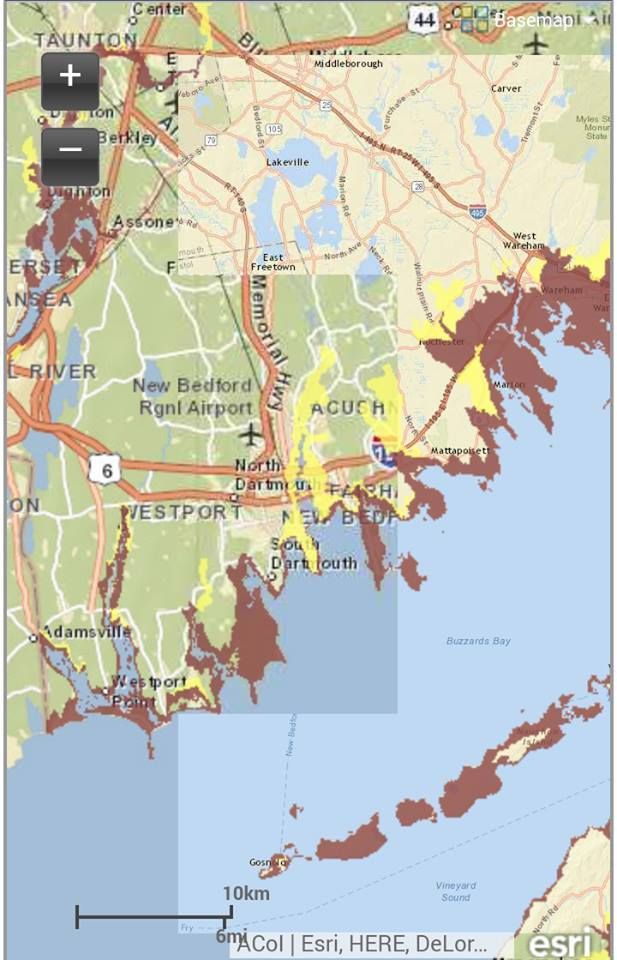
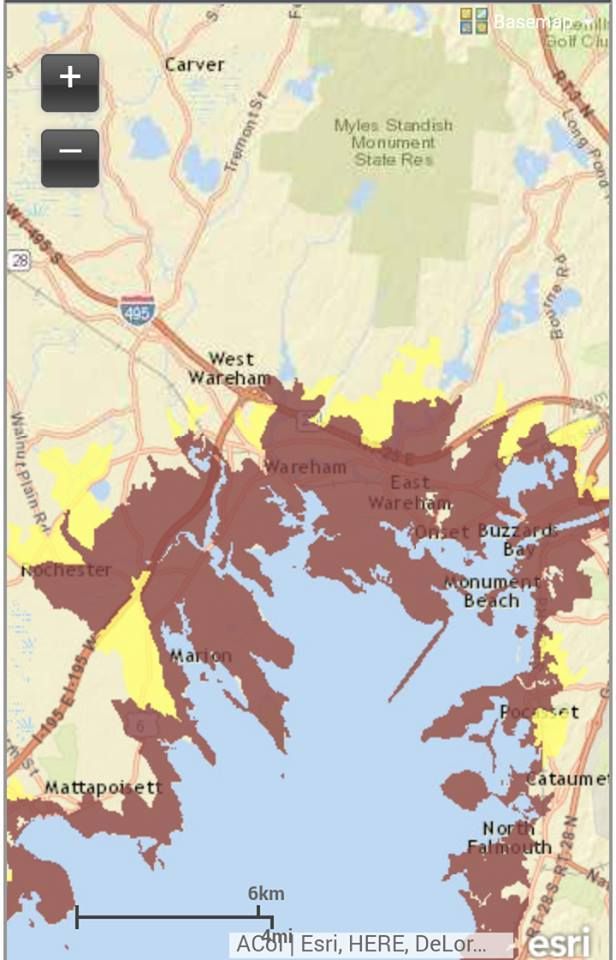
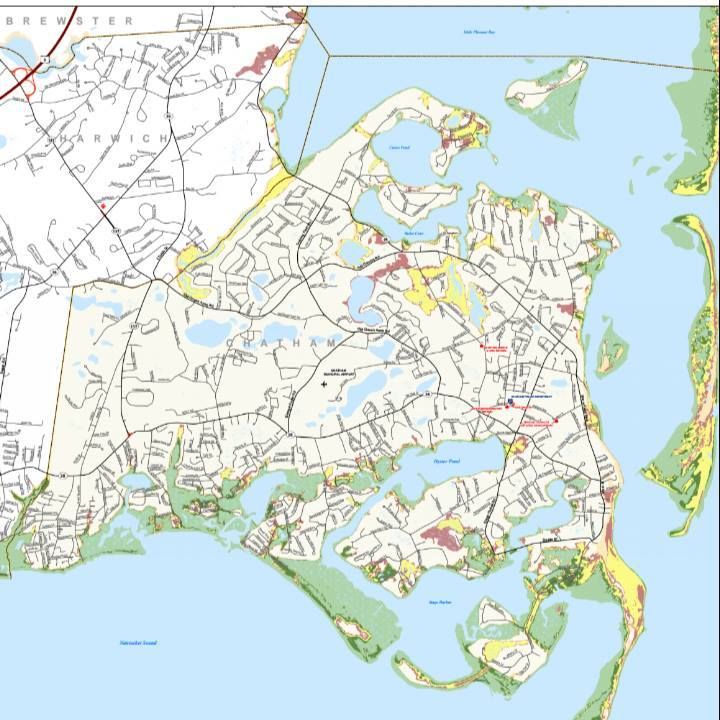
We have two maps from FEMA to check out today. The map above is a Hurricane Inundation map, and it depicts storm surge from a direct hit hurricane visiting Chatham at mean high tide. It also shows what sort of storm would be needed to soak certain regions, which we'll get to in a minute.
The map is from the combined efforts of FEMA, MEMA, NOAA and the NHC. They use the funny-weatherman-titled SLOSH model of storm surge estimation. They do not depict freshwater flooding.
The colors relate to the Saffir-Simpson scale of hurricane intensity, and break down like this:
Light Green = Category 1 hurricane. Hurricane Gloria was one of these, and the offshore Halloween Gale was, too. Although not a tropical system, the Blizzard of '78 did Cat. 1-style damage.
Dark Green = Category 2 hurricane. Hurricane Bob was one of these.
Yellow = Category 3 hurricane. We've only had five of these hit New England since the Other Man arrived in 1620, the most recent being Hurricane Carol in 1954.
Pink = Category 4 hurricane. We've had one in recorded New England history, and it struck in 1635.
Flesh = One Hundred Year FEMA Food Zone. This is the "100 year storm" you hear people speak of, but you have to go pre-Colombian to find them ("going pre-Colombian" means using salt marsh soil samples to look for sand layering associated with large hurricanes). New England has had storms in the Category 4+ level in the 1100s, the 1300s, and the 1400s.
Sorry about Flesh, but my knowledge of color names was and continues to be heavily influenced by whoever was in charge at Crayola in the 1970s.
 |
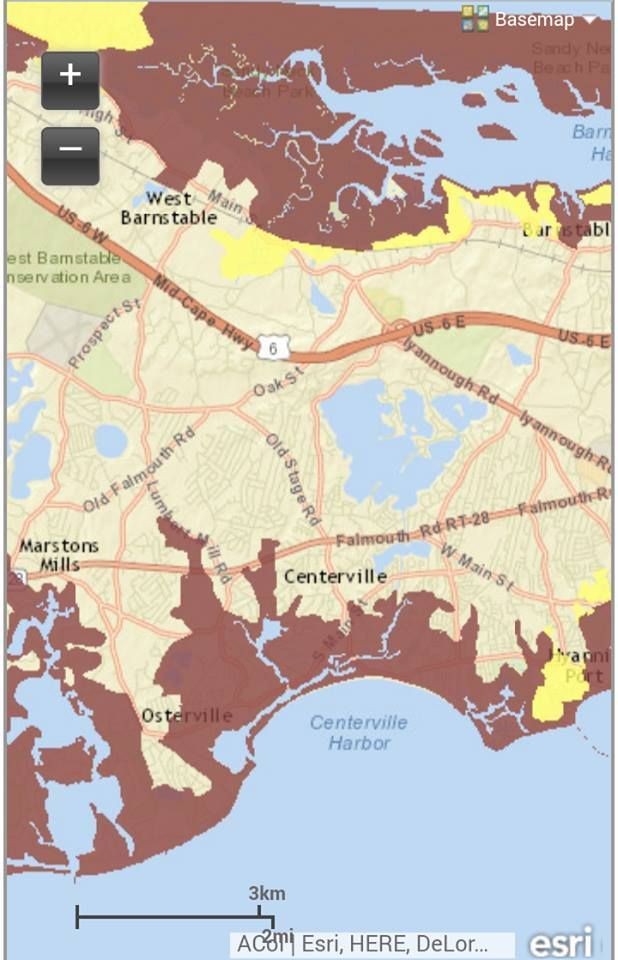
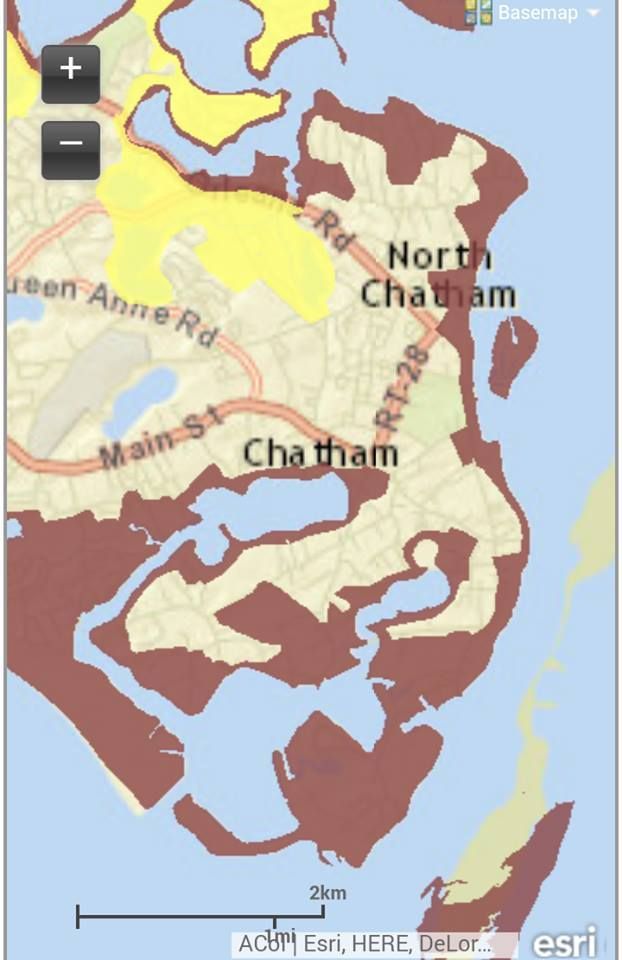
| Zoomed out... blurry, but anything unshaded is flooded.... |
Note that you don't need to be in a shaded area to get yourself a quick and sudden Ending. You can have a tree fall on you, have your car washed out in street flooding, step on a downed power line, get purged by looters, enjoy the Robespierre treatment from flying shingles, be summarily executed by National Guardsmen, or even stumble into a sharknado. There's no shortage of ways for you to get Left.
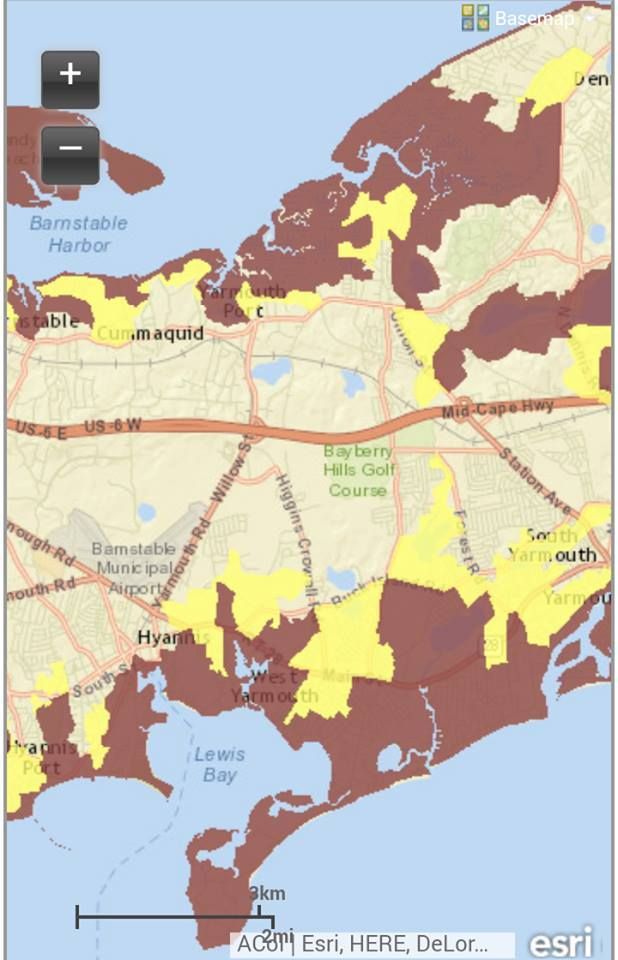
With that in mind, we now present to you the down-there-somewhere Evacuation Zone map.
Remember, you don't HAVE to leave when 5-0 tells you to. Also remember that the cop you read the Constitution to before the storm may be the one who has to fish you out of the drink when the ship hits the fan.
The E-map is easier to read, as it is made up of only two colors.
Red = Get Out.
Yellow = Get the f*** out.
Evacuation Maps
Worst Hurricanes To Hit New England
List of all hurricanes to hit New England