Wareham has a long and lengthy history with ol' Mister Hurricane. Just looking at that map above without knowing what it means, you can see that trouble would be afoot for ?ham if the barometer drops too much.
Wareham has taken beatings from Hurricane Bob, the Long Island Express, and a dozen other storms, and that's just in White Guy history. If you work in the native population, the numbers become countless after an eon or ten.
The 'Ham ( I really want to write a cop show for TV, base it in Onset, and call it "The 'Ham") suffers from the same problem which places like Bangladesh have.... it exists at the tip of a funnel. The funnel is formed by Buzzards Bay. That's the body-of-water Buzzards Bay, not the village part of Bourne... those people share the same Bangladeshian funnel problem that ?ham has.
Hurricanes, with both the wind and storm surge, push water ahead of them. That's actually what the storm surge is. It's not a problem in the middle of the Atlantic, but that water has to come ashore somewhere, and that somewhere is often at what they call the head of the bay. That's Wareham.
In fact, the "where" sound in Wareham may actually refer to "where the water goes." Water cares very little about washing over roads, cars, houses, people.... once it gets off the beach, we have a natural disaster on our hands.
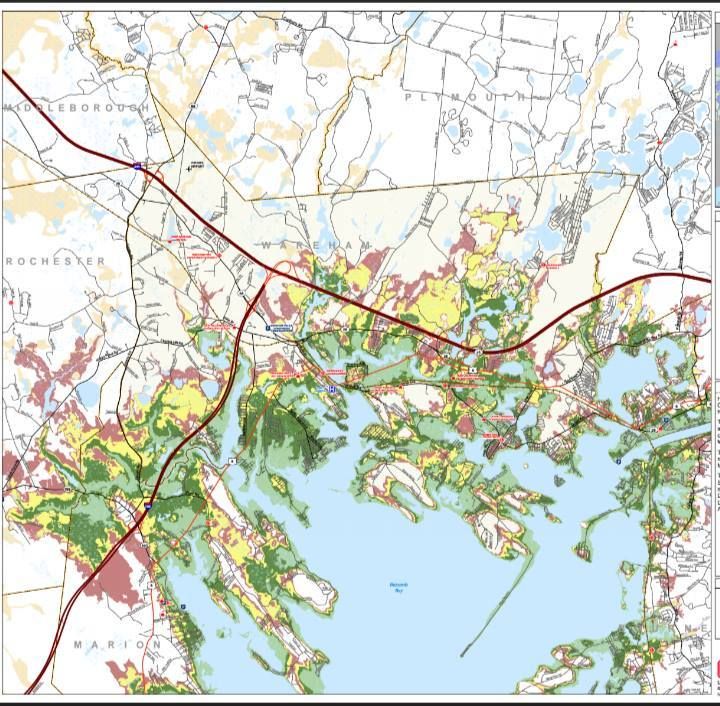
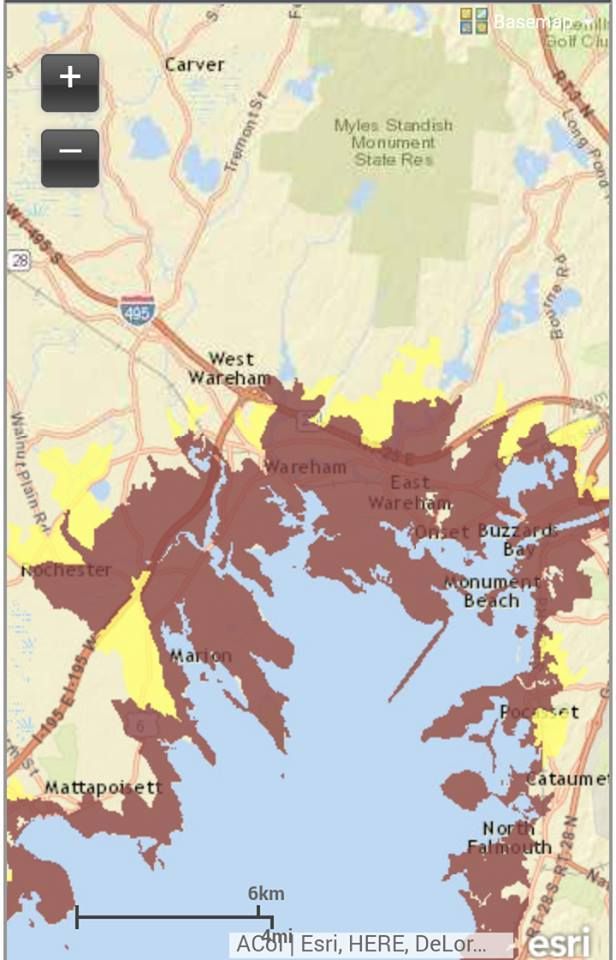
You have two maps here, folks... the upper one shows Inundation, and the lower one shows Evacuation Zones. The maps are from June of 2014, and- to my knowledge- are the plan du jour.
"Inundation" is a nice, painless term that means "covered in water," but you can change it to "Deathflood" or "Sea Plague" if it gets the troops moving quicker.
They (these maps are produced by the National Hurricane Center) assume that Wareham gets a direct hit at high tide, and follow the (groan) SLOSH model of seawater redistribution that MEMA and others use. They are assuming worst case everything insofar as wind direction, phase of moon (check that, they use Mean High Tide), forward speed of the storm and everything else goes.
For a basis of comparison, what Wareham got from Hurricane Gloria may have been a weak Category 1 storm (she came ashore in Connecticut), the Blizzard of '78 was about a strong Category 1/weak Category 2, Hurricane Bob was moderate Category 2 ("moderate" and "Category 2 hurricane" are kind of odd words to string together), old timers may have witnessed Hurricane Carol at Category 3, and The Great New England Hurricane of 1938 was a strong Category 3 made worse (Blue Hills got a 186 mph wind gust) by her forward speed.
The colors show which sort of storm will inundate which areas. Light green means you are hurting in even a weak hurricane. Any shift in colors after light green means that the storm will have to kick it up a notch to reach that area. Red areas are places that will only suffer- but suffer they will- in a Category 4 storm, the likes of which hasn't been seen by White Men in these parts. Hurricane Bob was our 11th deadliest storm ever in Massachusetts, in case you were wondering where your memories rank all-time.
The lower map, Evacuation Zones, is a bit easier to follow. They have three zones of evacuation. The third zone is reserved for storms we don't get, because I never saw the third color, and I looked at 30 town maps. The other colors break down as red = They Have To Leave and yellow = You Have To Leave, Too.
If you stare at the top map a bit an then stare at the bottom map, you'll get the basic idea of the Hows and Whys.
This is a frightening amount of Inundation territory. Wareham is home to 21,000 people. Almost all of them would be underwater in this scenario. To make it worse, these maps only show part of the problem. There will be high winds, downed wires, falling tree limbs, river flooding, sewer overflow, road washouts... you know, the whole nine.
I can leave the worrying to you. It's my job to provide the maps and some insight. My work is done here. Godspeed.
Hurricane Inundation Maps
Evacuation Zone Maps
No comments:
Post a Comment