Showing posts with label noaa. Show all posts

Monday, September 21, 2015

Chatham Hurricane Special


Chatham is, if you view Cape Cod as a big fist being shaken towards Europe, the Elbow. Like any other elbow, it's gonna get banged off things now and then. In this case, instead of a table, its a Hurricane.

There are no imminent storms, Chatham is just next up to bat in our ongoing series.

We have two maps from FEMA to check out today. The map above is a Hurricane Inundation map, and it depicts storm surge from a direct hit hurricane visiting Chatham at mean high tide. It also shows what sort of storm would be needed to soak certain regions, which we'll get to in a minute.

The map is from the combined efforts of FEMA, MEMA, NOAA and the NHC. They use the funny-weatherman-titled SLOSH model of storm surge estimation. They do not depict freshwater flooding.

The colors relate to the Saffir-Simpson scale of hurricane intensity, and break down like this:

Light Green = Category 1 hurricane. Hurricane Gloria was one of these, and the offshore Halloween Gale was, too. Although not a tropical system, the Blizzard of '78 did Cat. 1-style damage.

Dark Green = Category 2 hurricane. Hurricane Bob was one of these.

Yellow = Category 3 hurricane. We've only had five of these hit New England since the Other Man arrived in 1620, the most recent being Hurricane Carol in 1954.

Pink = Category 4 hurricane. We've had one in recorded New England history, and it struck in 1635.

Flesh = One Hundred Year FEMA Food Zone. This is the "100 year storm" you hear people speak of, but you have to go pre-Colombian to find them ("going pre-Colombian" means using salt marsh soil samples to look for sand layering associated with large hurricanes). New England has had storms in the Category 4+ level in the 1100s, the 1300s, and the 1400s.

Sorry about Flesh, but my knowledge of color names was and continues to be heavily influenced by whoever was in charge at Crayola in the 1970s.

Zoomed out... blurry, but anything unshaded is flooded....
We shall leave the street-by-street analysis to the reader, who can use the links I'll throw in at the end of the article to zoom in on their own house if it suits them.

Note that you don't need to be in a shaded area to get yourself a quick and sudden Ending. You can have a tree fall on you, have your car washed out in street flooding, step on a downed power line, get purged by looters, enjoy the Robespierre treatment from flying shingles, be summarily executed by National Guardsmen, or even stumble into a sharknado. There's no shortage of ways for you to get Left.

With that in mind, we now present to you the down-there-somewhere Evacuation Zone map.

Remember, you don't HAVE to leave when 5-0 tells you to. Also remember that the cop you read the Constitution to before the storm may be the one who has to fish you out of the drink when the ship hits the fan.

The E-map is easier to read, as it is made up of only two colors.

Red = Get Out.

Yellow = Get the f*** out.


Hurricane Inundation Maps

Evacuation Maps

Worst Hurricanes To Hit New England

List of all hurricanes to hit New England


Sandwich Hurricane Information

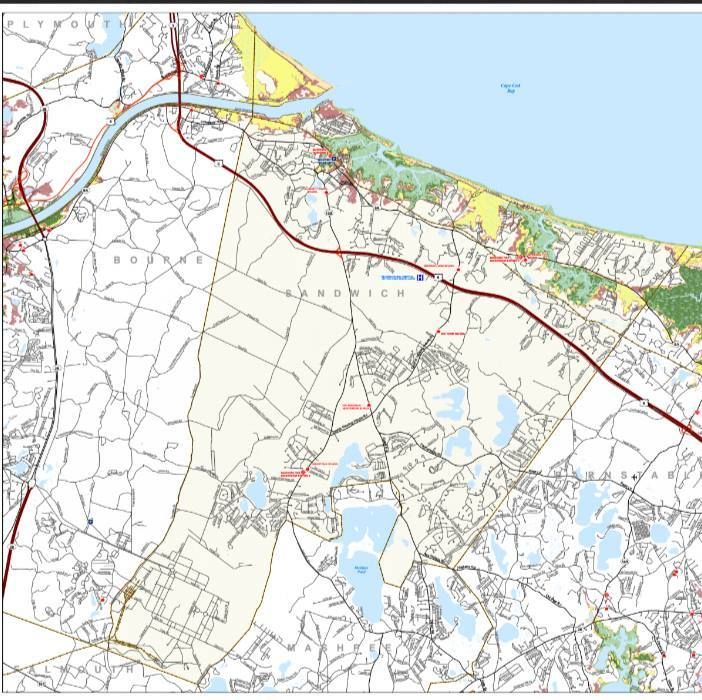
Sandwich is a town with a funny name, even in a state that has a Marblehead and an Athol in it. Sandwich is also a town with gorgeous beaches and marshes, which are awesome for 364 days a year. Those beaches and marshes become a problem when a hurricane comes to town.

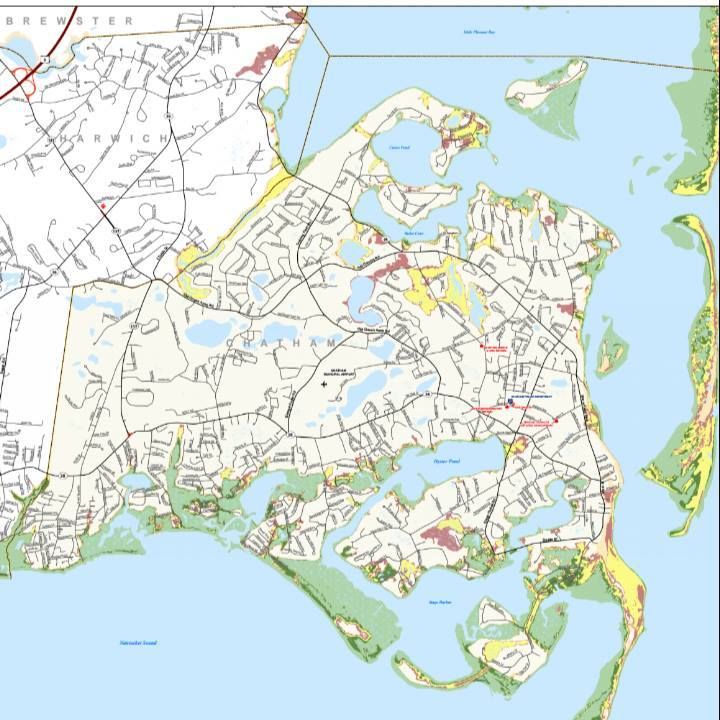
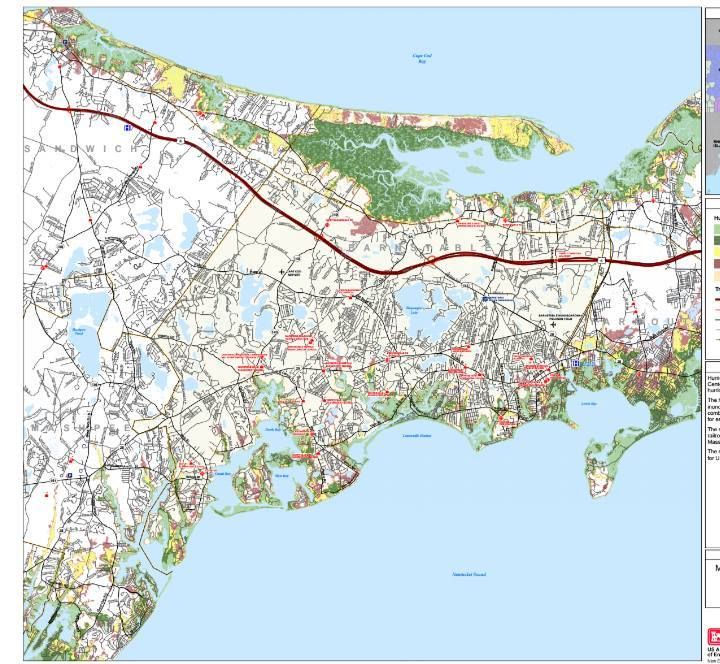
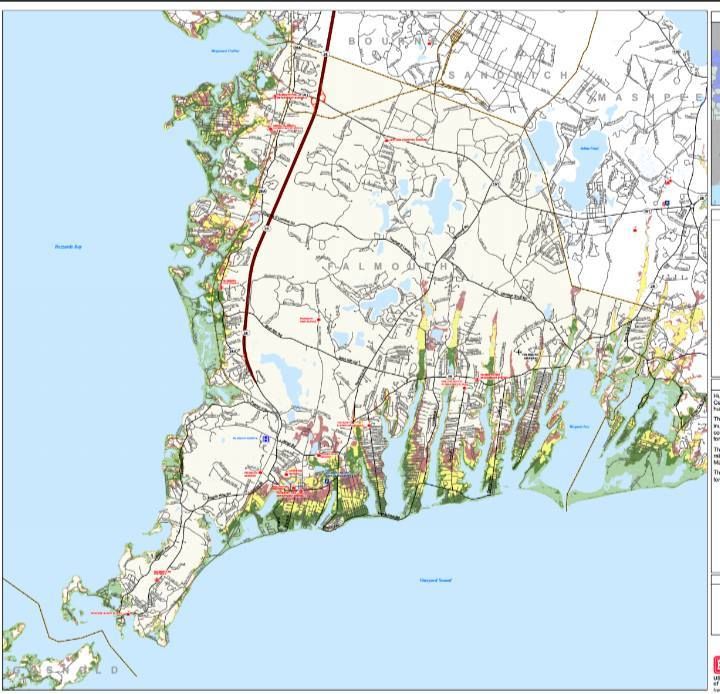
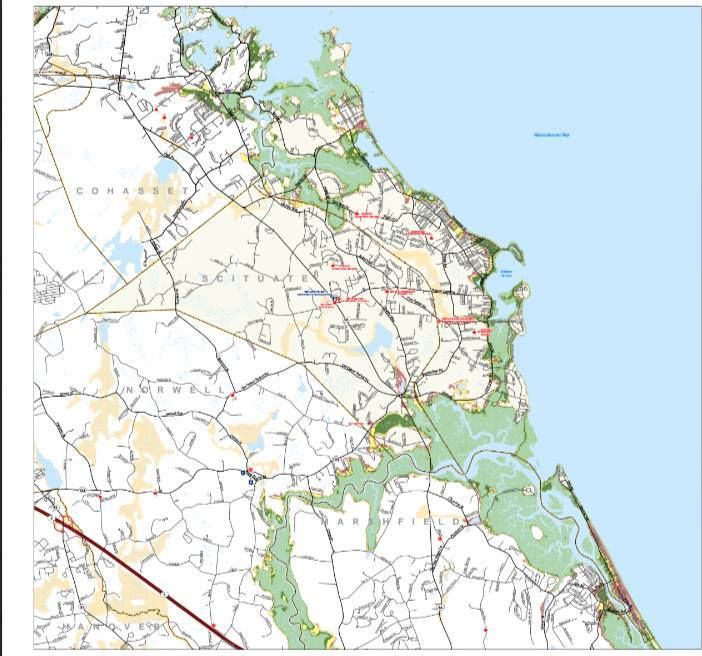
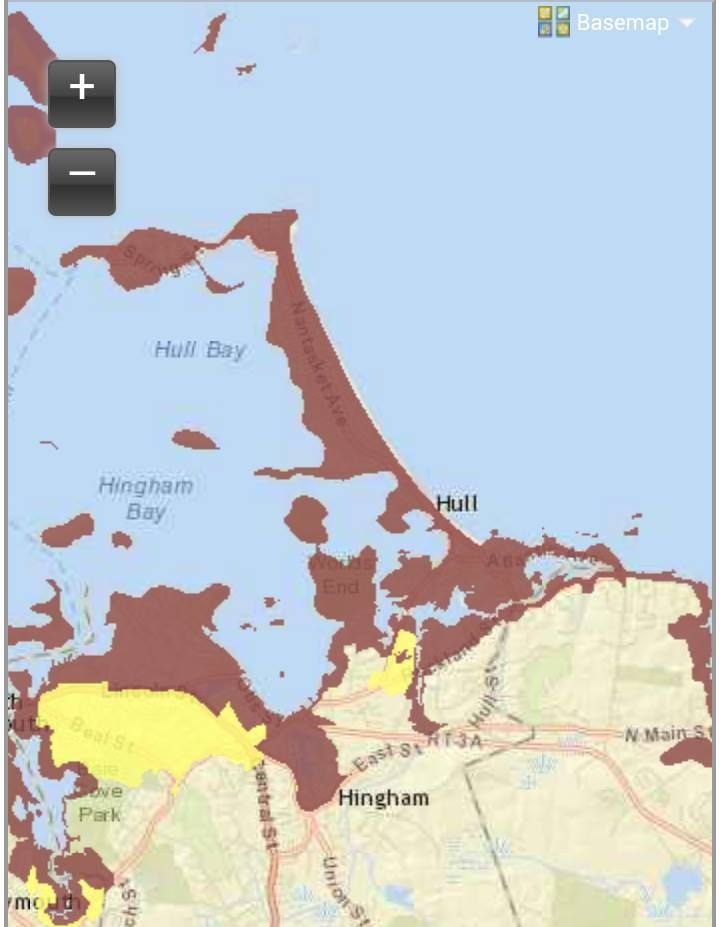
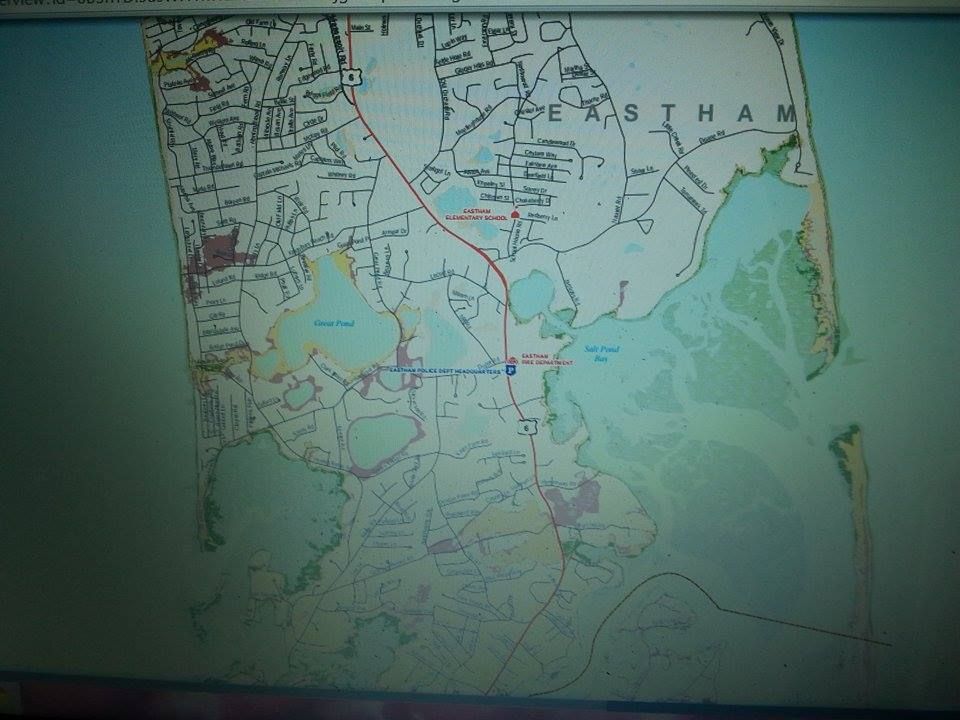
We come to you today to talk about hurricane maps. These maps come from FEMA, MEMA, NOAA and NHC. The map at the top of the page is a Hurricane Inundation Map.

Here's how it works:

Light Green = Category 1 hurricane. Hurricane Gloria was one of these, and the offshore Halloween Gale was, too. Although not a tropical system, the Blizzard of '78 did Cat. 1-style damage.

Dark Green = Category 2 hurricane. Hurricane Bob was one of these.

Yellow = Category 3 hurricane. We've only had five of these hit New England since the Other Man arrived in 1620, the most recent being Hurricane Carol in 1954.

Pink = Category 4 hurricane. We've had one in recorded New England history, and it struck in 1635.

Flesh = One Hundred Year FEMA Food Zone. This is the "100 year storm" you hear people speak of, but you have to go pre-Colombian to find them ("going pre-Colombian" means using salt marsh soil samples to look for sand layering associated with large hurricanes). New England has had storms in the Category 4+ level in the 1100s, the 1300s, and the 1400s.

Sorry about Flesh, but my knowledge of color names was and continues to be heavily influenced by whoever was in charge at Crayola in the 1970s.

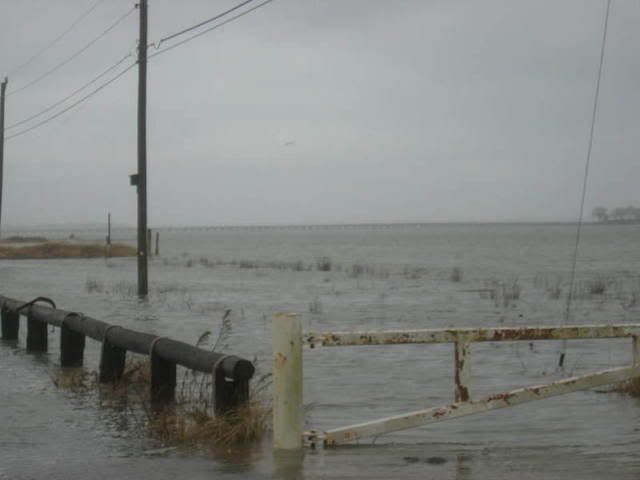
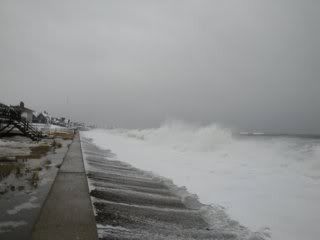
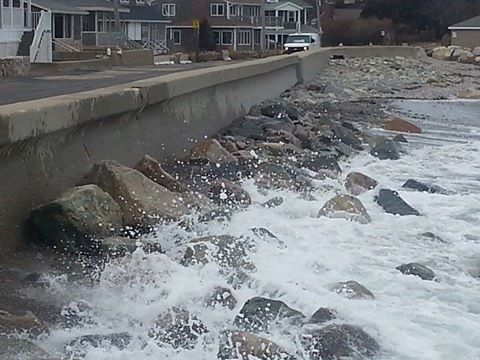
Yes, that's Duxbury, and yes, that's from a nor'easter and not a hurricane, but it is Inundation.
"Inundation" is a big word for "storm surge," which are two small words for "saltwater pushed ashore ahead of an incoming cyclone." Feel free to develop more colorful terms like Deathwash or Liquid Doom if that gets your people serious. Flooding is the big killer in hurricanes, sort of what artillery is to warfare.

This map is based on the zany-weatherman-titled SLOSH model for storm surge inundation. It depicts the inundation that FEMA thinks will occur with a direct-hit hurricane arriving at mean high tide. It does not account for freshwater flooding. It also shows what intensity (on the Saffir-Simpson hurricane intensity scale) of storm would be needed to soak certain parts of Sammich.

I have written this very same article for every town in SE Massachusetts with a coastline, and many towns are tricky with flooding. Pembroke, which isn't even near the ocean, will get some salt water in a bad enough hurricane. Mattapoisett floods several miles inland, while New Bedford should- in theory- hardly flood at all.

Sandwich isn't even a little bit tricky. Most of her flooding will occur very close to shore, and you can pretty much guess where it will happen if you take a Sunday drive through town. Granted, someone with my job has looked at a lot of hurricane inundation maps and gets sort of jaded with coastal destruction, but nothing on the Sandwich map makes me say "Damn... who woulda thunk?"

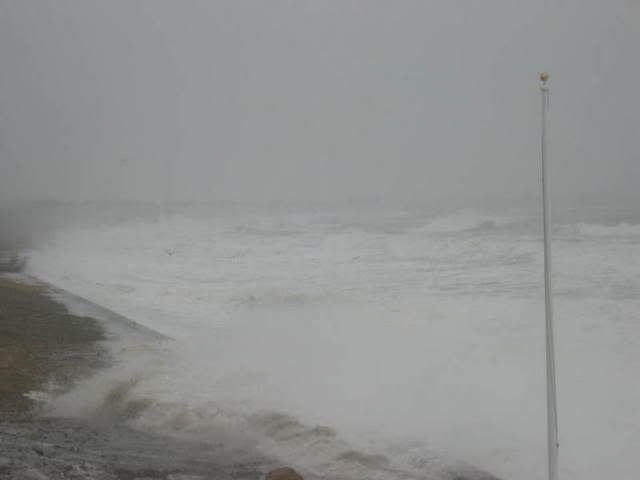
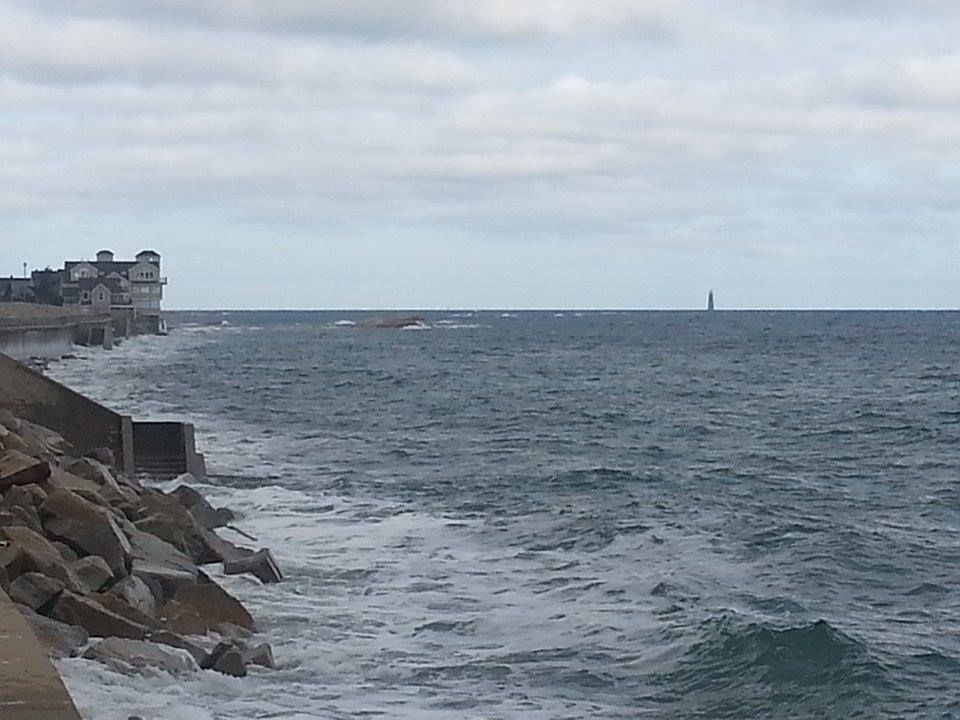
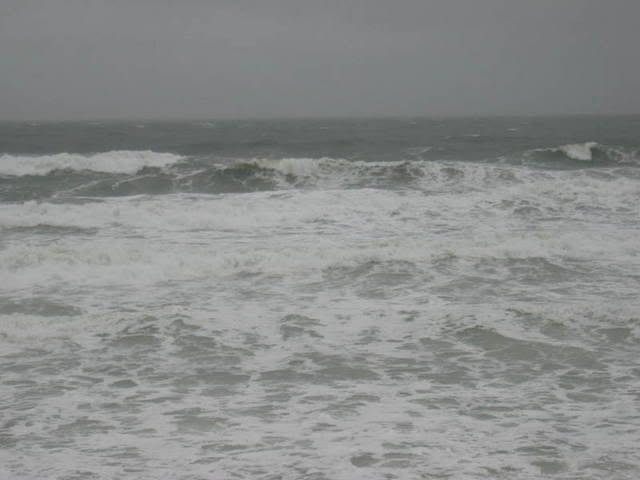
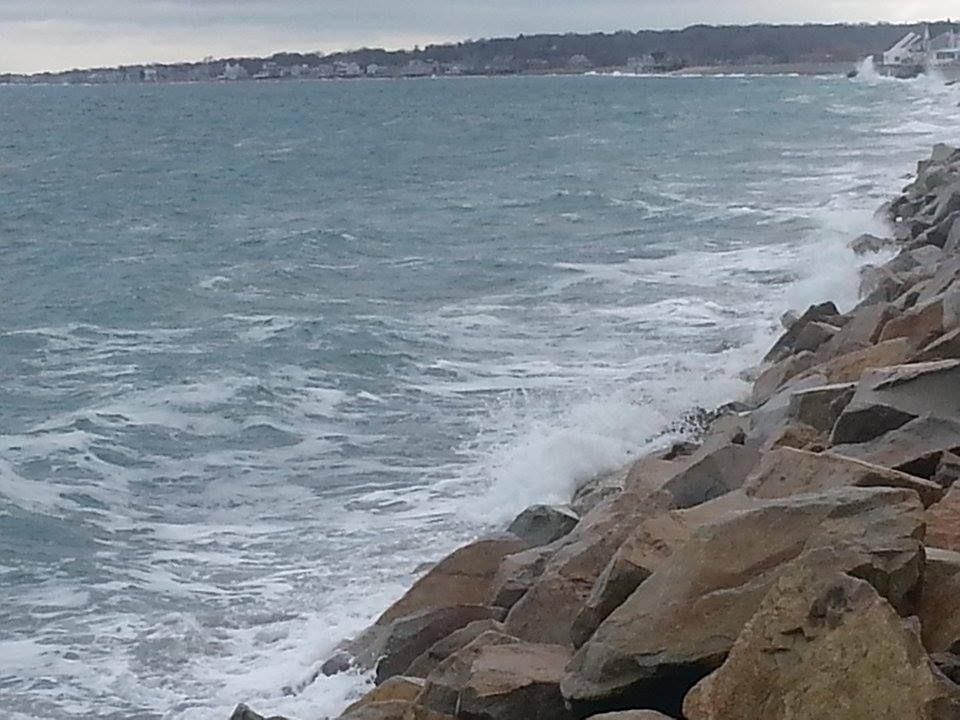
That's not snow, it's, uhm, stubborn hurricane wave foam...
Now, don't look at that map, see that your neighborhood isn't colored (FEMA is very egalitarian, and "colored" neighborhoods on FEMA maps are generally populated by less swarthy, waterfront-property-having folks... towns with significant minority populations usually have them in the White neighborhoods), and think that you are off the hook from hurricane damage if one comes up on us. No.

You can get Ended in an innumerable amount of ways if a hurricane hits Sammich, only a few of which involve saltwater inundation. You could step on a downed power line, get the Charles I treatment from flying debris, drown in pond flooding, have a tree fall on your car, get crucified by purging looters, get swallowed (either up into a cyclone or down into a whirlpool), drown in your attic, suffer summary execution by the National Guard, stumble into a sharknado... trust me, I'm just scratching the surface here, player.

We want you alive. Beyond base reasoning like "If you actually looked at this article, we cherish you and cannot fiscally afford to lose your potential site visits," we also have a sort of "If they utilized the article properly, they live" professional pride thing going on. We also want you alive for regular, nice-person reasons. You're our kind of people.

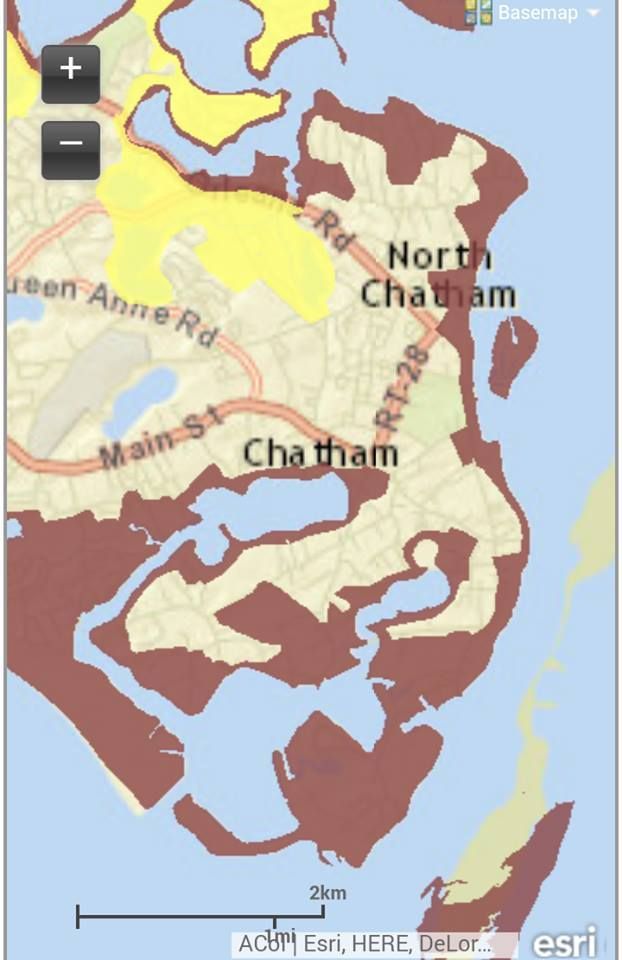
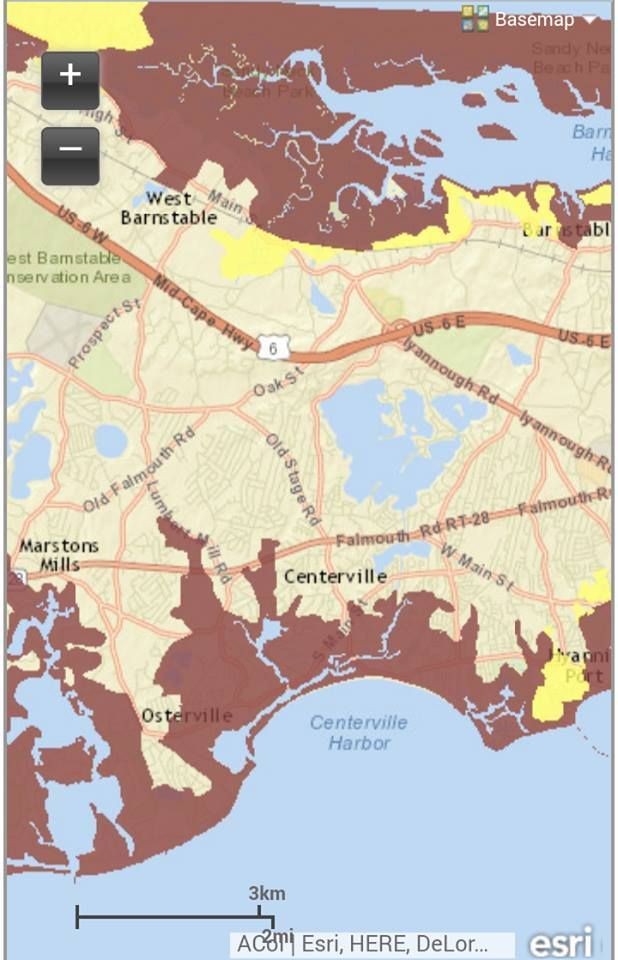
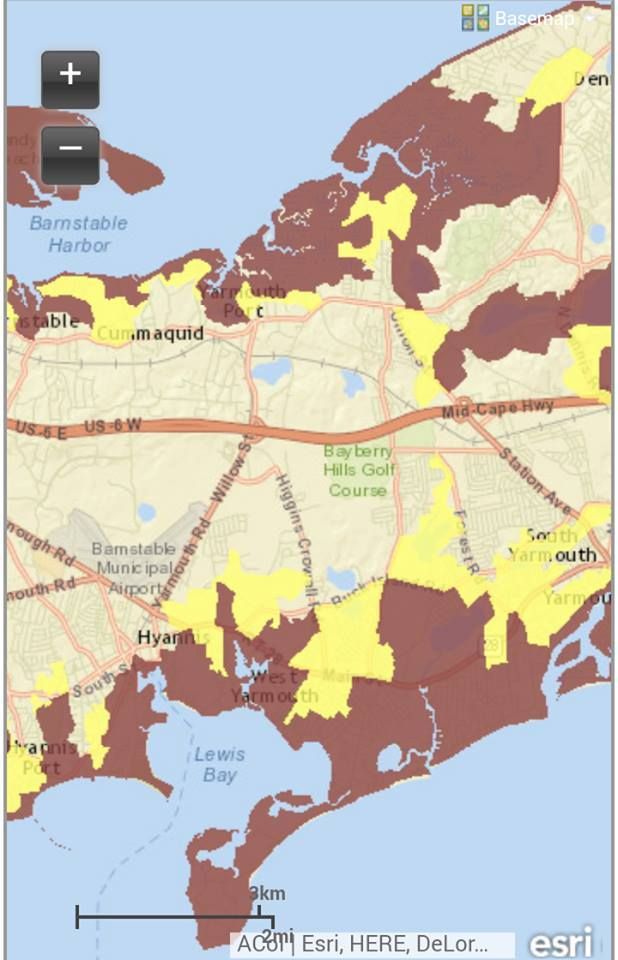
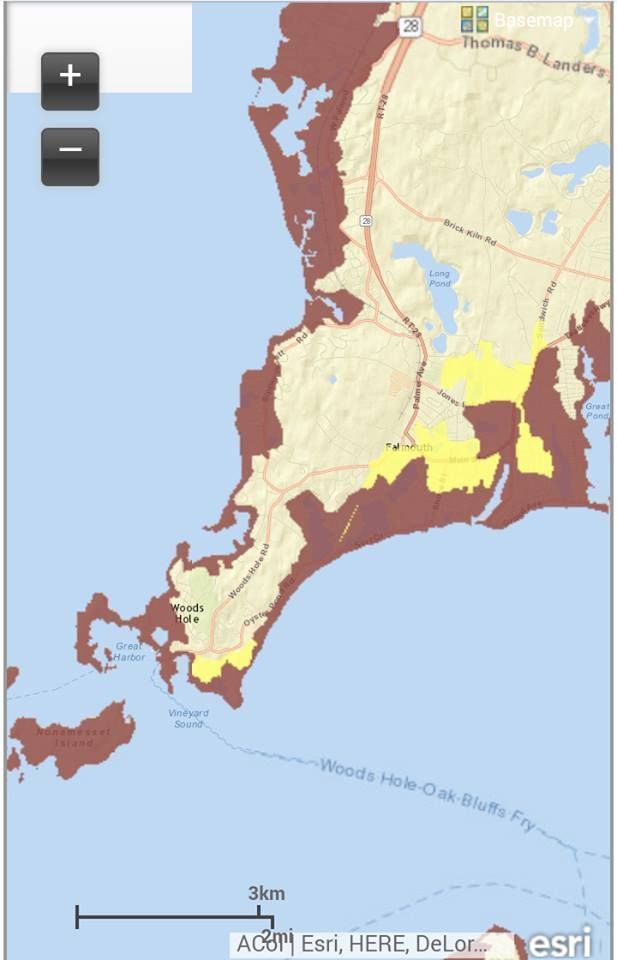
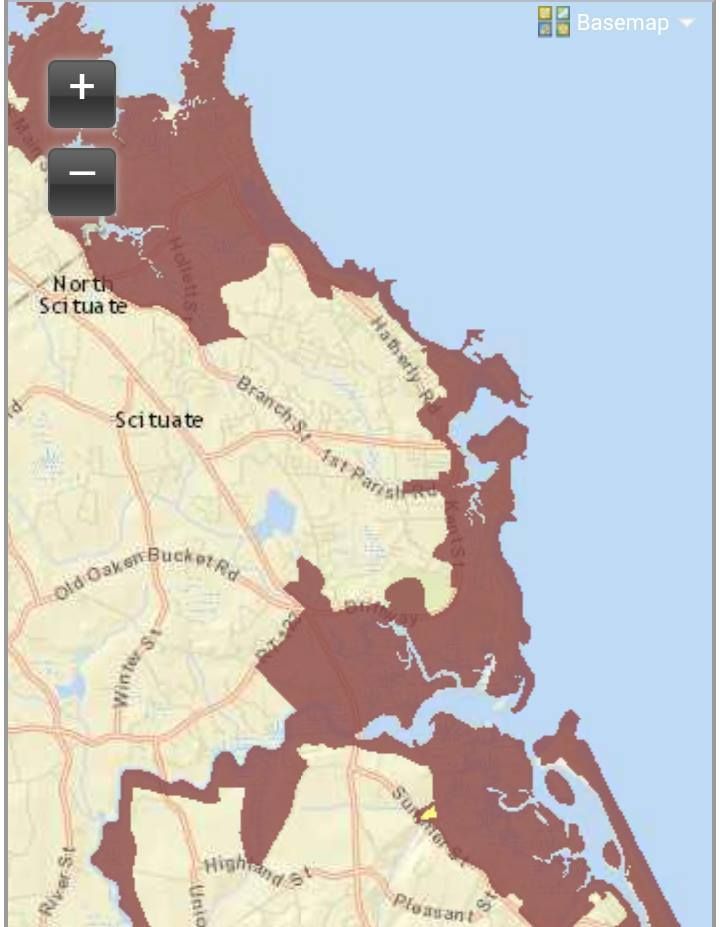
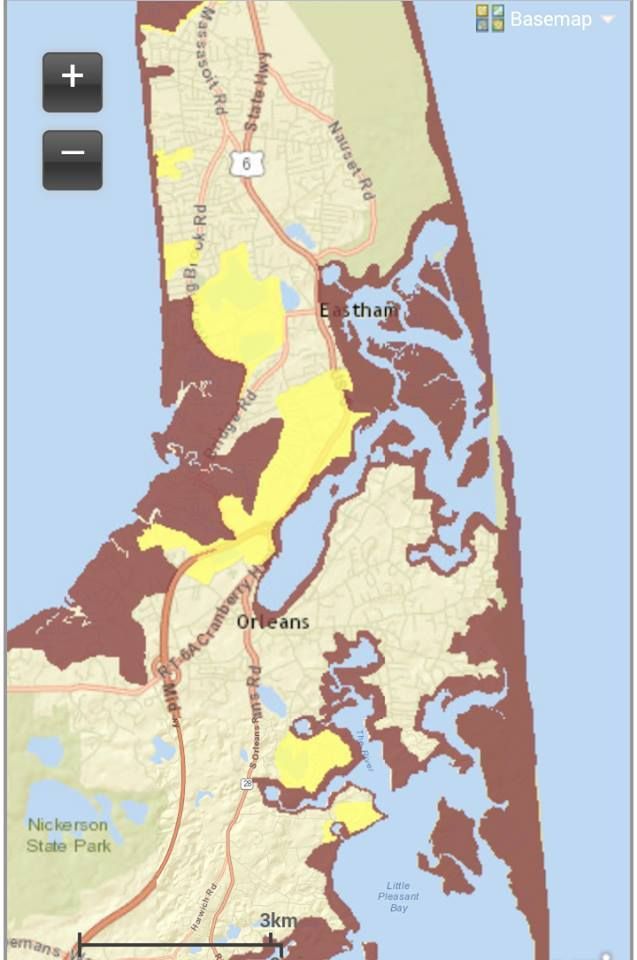
This leads into our next map, the Evacuation Zone map. This one is much less nuanced than the Inundation map, in that there are only two colors.

They basically break down to:

Pink = These people should leave.

Yellow = You should leave, too.


Here are a few things that my highly trained eye sees with these here maps of ours:

- Storms will be very, very capable of washing out Route 6A in some spots. This makes Scorton Neck into an island.

- Add that to "the bridges close when the winds top 70 mph or so," and you have a Trapped Sandwich.

- Marylou's of Sandwich is vulnerable to Category 4 storms, a problem I expect them to have solved before the next Category 4 storm hits. I need Marylou's, as I don't like Red Bull and this site doesn't make enough for me to afford cocaine.

- The Sandwich fire and police stations are vulnerable to even a minimal hurricane.

- You're safe off Route 130, and I'd encourage coastal people to befriend someone off 130 well enough to be granted asylum from the storm.

- Even a minor hurricane will at least temporarily end Sandwich's above-water presence on the mainland.

- The Canal would only spill over in Category 3 and above.

- The power plant is safe from flooding in all but the worst storms, according to FEMA.

- Ridiculous shoreline change is likely, with much sand loss into the marshes. Thanks to the Canal jetty and certain legislative failures, no replenishing sand will be forthcoming.

- We'll leave the street-by-street analysis to the reader. You can use the maps on the site to zoom in to your very home. We'll link you up at the end of the article, no worries.

- Seek out and question whichever old-timer has lived in your neighborhood the longest. Ask him or her what happened in Hurricane Carol. Find out how bad the road flooded, what happened to your house, how impossible escape was, and all that. You should never fail to utilize the Old School when planning your personal emergency response.


Bone up on the Hurricane Information with these handy links:

Hurricane Inundation Maps

Evacuation Maps

Worst Hurricanes To Hit New England

List of all hurricanes to hit New England


Sandwich Flood Mitigation Plan

(pictures by FEMA, Stacey Moreau and Carter Malpass)

Saturday, September 19, 2015

Barnstable Hurricane Information


Barnstable is in a position not unlike that which Germany faced in the World Wars. They have a two front battle going on if a hurricane arrives.

We have two maps from FEMA to check out today. The map above is a Hurricane Inundation map, and it depicts storm surge from a direct hit hurricane visiting Barnstable at mean high tide. It also shows what sort of storm would be needed to soak certain regions, which we'll get to in a minute.

The map is from the combined efforts of FEMA, MEMA, NOAA and the NHC. They use the funny-weatherman-titled SLOSH model of storm surge estimation. They do not depict freshwater flooding.

The colors relate to the Saffir-Simpson scale of hurricane intensity, and break down like this:

Light Green = Category 1 hurricane. Hurricane Gloria was one of these, and the offshore Halloween Gale was, too. Although not a tropical system, the Blizzard of '78 did Cat. 1-style damage.

Dark Green = Category 2 hurricane. Hurricane Bob was one of these.

Yellow = Category 3 hurricane. We've only had five of these hit New England since the Other Man arrived in 1620, the most recent being Hurricane Carol in 1954.

Pink = Category 4 hurricane. We've had one in recorded New England history, and it struck in 1635.

Flesh = One Hundred Year FEMA Food Zone. This is the "100 year storm" you hear people speak of, but you have to go pre-Colombian to find them ("going pre-Colombian" means using salt marsh soil samples to look for sand layering associated with large hurricanes). New England has had storms in the Category 4+ level in the 1100s, the 1300s, and the 1400s.

Sorry about Flesh, but my knowledge of color names was and continues to be heavily influenced by whoever was in charge at Crayola in the 1970s.


We shall leave the street-by-street analysis to the reader, who can use the links I'll throw in at the end of the article to zoom in on their own house if it suits them.

Note that you don't need to be in a shaded area to get yourself a quick and sudden Ending. You can have a tree fall on you, have your car washed out in street flooding, step on a downed power line, get purged by looters, enjoy the Robespierre treatment from flying shingles, be summarily executed by National Guardsmen, or even stumble into a sharknado. There's no shortage of ways for you to get Left.

With that in mind, we now present to you the down-there-somewhere Evacuation Zone map.

Remember, you don't HAVE to leave when 5-0 tells you to. Also remember that the cop you read the Constitution to before the storm may be the one who has to fish you out of the drink when the ship hits the fan.

The E-map is easier to read, as it is made up of only two colors.

Red = Get Out.

Yellow = Get the f*** out.

Notice that Route 28 washes out in a few spots.

It's a big town, we break the maps down a bit to make it easier for you

Egad! The Hyannis Port Compound could get soaked!


Hurricane Inundation Maps

Evacuation Maps

Worst Hurricanes To Hit New England

List of all hurricanes to hit New England


Thursday, September 17, 2015

Falmouth Hurricane Information Special


Falmouth holds a corner lot on Cape Cod, facing both Buzzards Bay and Nantucket Sound. You never want to have multiple county-sized bodies of water looking to push ashore into your town when a storm comes, which leads us to today's topic of discussion.

We have two maps for you to analyze with your friends and family. The map above is a Hurricane Inundation Map. It comes from FEMA, MEMA, NOAA and NHC, will be written about by ME, and read by U.

"Inundation" is a fancy word for "storm surge," which are two fancy words for "water pushed ashore by a storm." This is the killer in a storm, it's what did in New Orleans 10 years ago, and the maps give you several views of it.

You can see where water will come ashore in a direct hit hurricane arriving at high tide, and you'll see what degree of storm (via the Saffir-Simpson hurricane intensity scale) will flood different parts of town. They are based on the zany-weatherman-titled SLOSH model of storm surge inundation.

These maps do not project freshwater flooding things like rain, overflowing rivers and sewer backups, as well as people just spraying the hose into the street for the hell of it, mid-storm, because Falmouth is a hardcore sort of town.


Light Green = Category 1 hurricane. The Blizzard of '78 and the Halloween Gale are good examples of Category 1 storm damage, although neither was directly a hurricane. If those didn't hit hard down there (I'm a Duxbury kid, and was on Duxbury Beach for '78 and '91), use Hurricane Gloria as a hits-at-low-tide benchmark.

Dark Green = Category 2 hurricane. Hurricane Bob was a weak Category 2, and yes we do realize that "weak" and "Category 2 hurricane" are odd words to chain together.

Yellow = Category 3 hurricane. We've only had five storms of this strength hit New England since the Other Man arrived in 1620, the most recent being Carol in 1954.

Pink = Category 4 hurricane. We've had one in recorded history, in 1635.

Flesh = 100 Year FEMA Flood Zone. This is the "hundred year storm" you hear about, although you have to go pre-Colombian to find them. New England was hit by storms greater than Category 4 in roughly 1100 AD, 1300 AD and 1400 AD. They can tell by checking layers of sand on salt marsh muck.

Sorry about "flesh," my knowledge of colors was greatly dictated by the people at Crayola in the 1970s.


You can check these maps in far greater detail by going here and zooming a bit. It's disaster porn, styled to your very home!

Again, these maps do not depict freshwater flooding, and freshwater flooding will cause a whole slew of problems on her own if a hurricane says "Wuzzup?" to Wood's Hole.

Remember, you don't have to get flooded with seawater to die in a hurricane. You can get hit by lightning, sucked into a river, mashed in a road accident, have a tree fall on you, step on power lines, stumble into a sharknado or be killed by looters.

These maps show you what dangers face your particular house, and you can use them to decide on whether to make a run for it or not.


We'd also advise you to chat up the oldest guy with the longest residency in your neighborhood. Find out what Carol did to the house you live in now. Find out how high the water was in the street, how long the power was out for, what roads become impassable, and any other k-nuggets of knowledge the old fella might have.

Cranberry County Magazine stands strong behind our philosophy that your hurricane preparation planning is incomplete until you talk to some white heads. Your neighborhood's Old School is an asset which should not be underutilized.

FEMA and GRAMPS may hold differing opinions as to when you should flee, but FEMA most likely wasn't living on your street in 1954 when Carol came ashore. Gramps was. If he says your street floods and FEMA doesn't (my own neighborhood floods in nor'easters, but FEMA gives it Category 4 status), you may want to do some serious merit-weighing when deciding if you should Get To Steppin'.

This leads to our second map style, the Evacuation Map,

This is the map the authorities use when determining which neighborhoods will be evacuated. You don't HAVE to leave when the police tell you, but you also want to remember that the cop you were reading the Constitution to before the storm might very well be the one who has to make a decision as to whether or not to dive in to the maelstrom after you and your family.

I'm not chastising you. I watched the Halloween Gale from a waterfront home, with the police on a nearby hill blasting a searchlight on us the whole time.

Of course, that was a stupid move, so we'll work the other side now, and tell you about Feets Don't Fail Me Now, Heading For The Hills, and Running Like A Scaled Dog.

This map is easier to follow. It has two colors:

Pink = They have to evacuate.

Yellow = You do, too.

Here's the Evacuation Zone map:


Hurricane Inundation Maps

Evacuation Maps

Worst Hurricanes To Hit New England

List of all hurricanes to hit New England


Tuesday, September 15, 2015

Marion Hurricane Special


Marion is a beautiful town, one of the prettiest in America if you speak broadly enough. However, there are two views of Marion which are very, very ugly. Welcome to the Marion Hurricane Special.

Fear not... there isn't a hurricane heading for you. This is just Marion's turn in our summer feature, which covers the South Coast, South Shore and Cape Cod. We're going to review the Hurricane Inundation map and the Evacuation Zone map.

These maps come from the combined efforts of FEMA, MEMA, NOAA and NHC. They will be analyzed by ME, and read by U.

The map at the top is a Hurricane Inundation Map. Inundation relates to storm surge, which is the water pushed ashore by a large storm like a hurricane. You can call it the Deathflood or Liquid Doom if that gets your people moving faster. Flooding is the big killer with hurricanes, and it would be an issue in Marion.

You can use this map to determine what's what in your neighborhood when the flooding starts. It depicts a direct hit hurricane arriving at mean high tide. It does not depict freshwater flooding. They are developed by using the zany-weatherman-titled SLOSH model of storm surge inundation. They also show which intensity (on the Saffir-Simpson hurricane intensity scale) of storm would be needed to soak a particular region.

If you go to the MEMA site, you can zoom in on these maps with far greater detail, right down to your friggin' house, player!

Here's how the colors on the map shake out:

Light Green = Category 1 hurricane. The Blizzard of '78 and the Halloween Gale are good examples of Category 1 storm damage, although neither was directly a hurricane. If those didn't hit hard down there (I'm a Duxbury kid, and was on Duxbury Beach for '78 and '91), use Hurricane Gloria as a hits-at-low-tide benchmark.

Dark Green = Category 2 hurricane. Hurricane Bob was a weak Category 2, and yes we do realize that "weak" and "Category 2 hurricane" are odd words to chain together.

Yellow = Category 3 hurricane. We've only had five storms of this strength hit New England since the Other Man arrived in 1620, the most recent being Carol in 1954.

Pink = Category 4 hurricane. We've had one in recorded history, in 1635.

Flesh = 100 Year FEMA Flood Zone. This is the "hundred year storm" you hear about, although you have to go pre-Colombian to find them. New England was hit by storms greater than Category 4 in roughly 1100 AD, 1300 AD and 1400 AD. They can tell by checking layers of sand on salt marsh muck.

Sorry about "flesh," my knowledge of colors was greatly dictated by the people at Crayola in the 1970s.


You can check these maps in far greater detail by going here and zooming a bit. It's disaster porn, styled to your very home!

Again, these maps do not depict freshwater flooding, and freshwater flooding will cause a whole slew of problems on her own if a hurricane says "Wuzzup?" to Maid Marion.

Remember, you don't have to get flooded with seawater to die in a hurricane. You can get hit by lightning, sucked into a river, mashed in a road accident, have a tree fall on you, step on power lines, stumble into a sharknado or be killed by looters.

These maps show you what dangers face your particular house, and you can use them to decide on whether to make a run for it or not.

We'd also advise you to chat up the oldest guy with the longest residency in your neighborhood. Find out what Carol did to the house you live in now. Find out how high the water was in the street, how long the power was out for, what roads become impassable, and any other k-nuggets of knowledge the old fella might have.

Cranberry County Magazine stands strong behind our philosophy that your hurricane preparation planning is incomplete until you talk to some white heads. Your neighborhood's Old School is an asset which should not be underutilized.

FEMA and GRAMPS may hold differing opinions as to when you should flee, but FEMA most likely wasn't living on your street in 1954 when Carol came ashore. Gramps was. If he says your street floods and FEMA doesn't (my own neighborhood floods in nor'easters, but FEMA gives it Category 4 status), you may want to do some serious merit-weighing when deciding if you should Get To Steppin'.


This leads to our second map style, the Evacuation Map,

This is the map the authorities use when determining which neighborhoods will be evacuated. You don't HAVE to leave when the police tell you, but you also want to remember that the cop you were reading the Constitution to before the storm might very well be the one who has to make a decision as to whether or not to dive in to the maelstrom after you and your family.

I'm not chastising you. I watched the Halloween Gale from a waterfront home, with the police on a nearby hill blasting a searchlight on us the whole time.

Of course, that was a stupid move, so we'll work the other side now, and tell you about Feets Don't Fail Me Now, Heading For The Hills, and Running Like A Scaled Dog.

This map is easier to follow. It has two colors:

Pink = They have to evacuate.

Yellow = You do, too.

Here's the Evacuation Zone map:


Dig into some links, on us:

Hurricane Inundation Maps

Evacuation Maps

Worst Hurricanes To Hit New England

List of all hurricanes to hit New England


Monday, September 14, 2015

Scituate Hurricane Special


The tropics are stirring up a bit, so why not drop the Hurricane Special for Scituate?

Scituate, like her neighbors in Duxbury and Marshfield, is more of a nor'easter town than a hurricane town. That's actually a worse fate in Massachusetts, as we don't get hurricanes all that much, and the ones we do get break on the South Coast or Rhode Island first.

That matters very little when the waves are breaking on your house, but it matters a lot with these maps we'll be looking at today.

The map above is a Hurricane Inundation Map. It is brought to you today by an amalgamation of FEMA, MEMA, NOAA and NHC. It will be analyzed by ME, for U.

Inundation relates to storm surge, which is the water pushed ashore by a large storm like a hurricane. You can call it the Deathflood or Liquid Doom if that gets your people moving faster. Flooding is the big killer with hurricanes, and it would be an issue in Scituate.

You can use this map to determine what's what in your neighborhood when the flooding starts. It depicts a direct hit hurricane arriving at mean high tide. It does not depict freshwater flooding. They are developed by using the zany-weatherman-titled SLOSH model of storm surge inundation. They also show which intensity (on the Saffir-Simpson hurricane intensity scale) of storm would be needed to soak a particular region.

A direct-hit hurricane would be near impossible for Scituate, as it would have to loop around the Cape and drop back in on you. It's not impossible, according to Bistromath, it's just highly improbable. What is more likely is a Category X storm hitting the South Coast, then moving into Cape Cod Bay to hit Sit Chew It with X-Y. If you see Category 1 for Scituate, you know that Fairhaven probably got Category 2.

Here's how the colors work on the Inundation Map above:

Light Green = Category 1 hurricane. The Blizzard of '78 and the Halloween Gale are good examples of Category 1 storm damage, although neither was directly a hurricane.

Dark Green = Category 2 hurricane. Hurricane Bob was a weak Category 2, and yes we do realize that "weak" and "Category 2 hurricane" are odd words to chain together.

Yellow = Category 3 hurricane. We've only had five storms of this strength hit New England since the Other Man arrived in 1620, the most recent being Carol in 1954.

Pink = Category 4 hurricane. We've had one in recorded history, in 1635.

Flesh = 100 Year FEMA Flood Zone. This is the "hundred year storm" you hear about, although you have to go pre-Colombian to find them. New England was hit by storms greater than Category 4 in roughly 1100 AD, 1300 AD and 1400 AD. They can tell by checking layers of sand on salt marsh muck.

Sorry about "flesh," my knowledge of colors was greatly dictated by the people at Crayola in the 1970s.

You can check these maps in far greater detail by going here and zooming a bit. It's disaster porn, styled to your very home!

Remember, you don't have to get flooded with seawater to die in a hurricane. You can get hit by lightning, sucked into a river, mashed in a road accident, have a tree fall on you, step on power lines, stumble into a sharknado or be killed by looters.

This leads to our second map, the Evacuation Map,

This is the map the authorities use when determining which neighborhoods will be evacuated. You don't HAVE to leave when the police tell you, but you also want to remember that the cop you were reading the Constitution to before the storm might very well be the one who has to make a decision as to whether or not to dive in to the maelstrom after you and your family.

I'm not chastising you. I watched the Halloween Gale from a waterfront home, with the police on a nearby hill blasting a searchlight on us the whole time.

Of course, that was a stupid move, so we'll work the other side now, and tell you about Beating Feet, Hightailing It, and Running Like A Scaled Dog.

This map is easier to follow. It has two colors:

Pink = They have to evacuate.

Yellow = You do, too.

Here's the map:


As you can see, Scituate is pretty much Get To Steppin' City if a storm is coming. She's low-lying, and is one of the first towns on the South Shore who get no barrier beach protection from Cape Cod. Much like how they vote in Chicago, Scituate will flood early and often.

Cranberry County Magazine is very much pro-Ask Old People Stuff. If you have some codger on your street who was here for Hurricane Carol, get a few drinks in him and pump him for storm information. Never let the Old School be an unutilized resource, player.

Grandpa may not work for FEMA, but FEMA most likely didn't have someone living on Oceanside Drive during Hurricane Donna. Find out what happened.

No one is going to tell you that Scituate is more dangerous than, say, Lynn.... but if the barometer drops, Scituate is about as bad as it gets. You want to have a rough idea of what danger your house faces, and you want to know if people who study weather for a living would evacuate if they owned your house.

Bone up on some local hurricane knowledge, oh people of Scituate!

Hurricane Inundation Maps

Evacuation Maps

Worst Hurricanes To Hit New England

List of all hurricanes to hit New England


FEMA

MEMA

NOAA

NHC

Cranberry County Magazine wants you alive for several reasons:

- I love showing non-Massachusetts people the written word "Scituate," and seeing if they can pronounce it properly. If Scituate gets wiped off the map, the default towns are Billerica, Gloucester, and Worcester.

- Professional Pride. "If they followed my advice, they're alive."

- Economics. Cranberry County Magazine can not afford to lose one person who opened this page, even if they did so by accident.

- Regular, nice people reasons.


Tuesday, September 8, 2015

Come Hull or High Water: One Hull Of A Hurricane Preparation Article

"If I owned Hull and Texas, I would live in Hull and rent out Texas."
Hull sticks way out into the ocean, which is never a good thing in a coastal flooding scenario. It is very low-lying in spots, also a bad. It is also very densely populated, which complicates things further.

That map above is a Hurricane Inundation Map, from FEMA, MEMA, NOAA and NHC. The analysis is by ME, a lowly NWS volunteer spotter who happens to be Boss Hogg here at Cranberry County Magazine. The map is based on the zany-weatherman-titled SLOSH model of storm surge inundation.

"Storm surge" is the water pushed onshore in a storm. If you're standing at the high tide mark and a ten foot storm surge comes ashore, you'll be under ten feet of water. You can call it a Deathflow or Liquid Doom if it gets your people moving more quickly.

These maps depict the estimated storm surge for Hull in the event of a direct-hit hurricane arriving at mean high tide. They also show what sort of storm would e required to flood certain areas. They do not depict freshwater inundation that could result from heavy rain, sewer backups, and river/stream overflow.

The maps work like this:

Light Green = Category 1 storm. The Halloween Gale is a good-although-offshore example of a Category 1 hurricane, while the Blizzard of '78, though not a hurricane, is also a good model for estimating this sort of damage/risk.

Dark Green = Category 2 hurricane. Hurricane Bob was a weak Category 2 hurricane. Yes, "weak" and "Category 2 hurricane" are funny words to string together.

Yellow = Category 3 hurricane. We have only had five Category 3 hurricanes since the Other Man arrived in 1620, the last one being Hurricane Carol in 1954.

Red = Category 4 storm. We've had one in recorded history, in 1635.

Flesh = 100 Year FEMA Flood Estimates. This is the "hundred year storm" you hear people speak of, although you have to go pre-Colombian to find evidence (marsh mud samples are analyzed for otherwise unexplainable sand layering to determine prehistoric hurricane histories for areas with dunes in front of marshes) of storms of this power striking New England. According to my research, we got tuned up on to this extent in the 1100s, the 1300s, and the 1400s.

As we were saying before, you people are in a Hull of a spot.
"We're surrounded!" "We're supposed to be surrounded, we're paratroopers Hull."
Yes, you are surrounded... by water, and you don't live on mountains. When the water rises, it likes to come and visit coastal communities. That is going to make things very sketchy in H-you-double hockey sticks.

Hull could go from peninsula to island very quickly if a hurricane came to town. These maps help give you an idea of what sort of risk you face.

Hull does catch a break, in that a hurricane is almost never going to land a direct hit on Hull. It will come ashore on the South Coast, Cape Cod or Rhode Island before reaching Hull, and that will blunt the effects somewhat.

Hull will also benefit from the fact that hurricanes historically have a tendency to right-hook just before hitting Cape Cod, thus keeping Chatham and Wellfleet between the hurricane and Hull. That effect is erased when the storm plows through Cape Cod Bay, of course.

You can analyze the map for yourself, although I do feel obliged to note that Hull High will be underwater in even minor storms. The roads out will be blocked as well.

Talk to old-timers who were on Hull for Hurricane Carol or even the 1938 hurricane. Locals know stuff that FEMA doesn't, as odd as that sounds. I disagree with FEMA on my own neighborhood (Duxbury Beach), and my hurricane pedigree only runs back to Hurricane Belle. Keepers of the Old School actually watched hurricanes hit Hull, something most FEMA kids can't say.

Hull does have some high ground (World's End is safe from most storms, I was somewhat disappointed to discover), and you should both 1) know where it is and 2) befriend people who live on it.

We can now move on to the Evacuation Map.

"Oh Baby, Please Don't Leave Me!"
This one is easier to read. Red means "They'd better leave," and Yellow means "You'd better leave, too."

Hull, in a hurricane, is a French word for "Flee." Pretty much everyone in town should give serious thought to a good Skedaddle. A good run is better than a bad stand. That water will be coming ashore angry.

You don't HAVE to go. However, the cop you read the Constitution to before the storm will also be the one who may have to pull you out of the floodwaters, so use your best discretion and stuff.

Hull will be a nightmare to evacuate. As anyone who drives home from a bar knows, there's really only one road out. Hull also enjoys the distinction of being the 4th smallest town by land area in the state, yet having one of the longer coastlines... while also being top 30 in population density.

Also note that you can be killed by a hurricane very far back from shore, even in areas not demarcated by either map. A river could overflow, power lines could fall, the winds could decapitate you with a pizza box, and you could very easily end up in a sharknado.

We want you alive. We want you alive for monetary reasons, as this site depends on you dropping by now and then. We want you alive for reasons of professional pride, i.e. "If they listened to me, they got out in time." We also want you alive for regular, nice-people reasons.

"I advocate hanging on as long as possible."


Check out MEMA Hurricane Inundation Maps for yourself... laugh at those less fortunate than yourself, while planning defense strategies for people trying to get into your house to seek refuge.


Monday, September 7, 2015

Eastham Hurricane Primer: Inundation and Evacuation


Eastham is a tough town to describe when viewed from above. There's not really a word for her shape. You could never sketch a map of Eastham from memory, like you could do with, say, Wyoming.

All of those coves and marshes and tidal creeks and barrier beaches combine to make a tricky hurricane forecast for the Easternmost Ham.

We have two maps for you to peruse. They come from an amalgamation of FEMA, MEMA, NOAA, and NHC. The map at the top of the page, and the ones in the article which look like it, are Hurricane Inundation Maps. They are based on the zany-weatherman-titled SLOSH model.

The Inundation maps are related to storm surge, which is seawater pushed inland ahead of a storm. Some of our past hurricanes have sent ashore some doozies. These maps show where storm surge is forecast to come ashore. They also purport to show how far inland storms of differing intensities will reach.

I'll leave the neighborhood-by-neighborhood discussion to the readers, who can zoom in on their particular house if they so desire by going to this page and clicking around a bit.


The picture quality is rough- I couldn't SAVE AS or PRTSC these pages for some reason which may be drug related, and instead took pictures of my screen with the girlfriend's phone- but a determined reader can figure out what they need to see.

Here is the color code we'll be using:

Light Green = Category 1 hurricane. That's the minimal kind, the weakest hurricane. The Halloween Gale is a good-if-offshore example of this kind of action.

Darker Green = Category 2 hurricane. While the landfall was far west of Eastham, Hurricane Bob was a Category 2 storm when it hit Rhode Island.

Yellow = Category 3 hurricane. Only five hurricanes of this intensity have hit New England since the people from Old England showed up, the last being Carol in 1954. Eastham's population was about 900 back then.

Red = Category 4 hurricane. They're estimating from almost 400 years ex post facto, but the Great Colonial Hurricane of 1635 may have been a Category 4 storm.

Flesh = 100 Year FEMA Flood Zone. This is the "hundred year storm." Brown University scientist-types measure pre-Colombian storm impacts by taking long tubes of marsh mud and analyzing sand layers which could only be put there by giant storms. New England was hit by Category 4+5 storms in 1100–1150, 1300–1400 (1295–1407), and 1400–1450 (1404–1446).

I'm no artist, and I use "flesh" as a color primarily because of whoever was in charge of Color Naming at Crayola in 1970. There's probably a better term. Inundation maps are very egalitarian, and due to their using White as a base color on the map, the "colored" neighborhoods are generally the less-swarthy waterfront-property-owning types of people.


Please note that these maps depict a scenario where a direct-hit hurricane arrives at mean high tide. Also note that they do not show impacts from freshwater flooding scenarios like heavy rainfall, freshwater stream overflow, sewer backups and even sociopaths spraying their garden hoses into the wind for the sheer joy of it.

A few quick notes about the maps:

-  A monster storm will reach inland far enough to cut off Route 6 in a few spots. You should try to be Ghost before that happens.

- Anything marshy will go under in a minimal hurricane.

- The only Flesh colors we see are on the outer dunes, and in a few spots by the fire station.

- I'm probably a bit late to this dance, but you could make a pretty good cheesy horror film about a hurricane flooding Eastham which also pushes sharks ashore to grab people out of The Friendly Fisherman and so forth.

- North Eastham should be called Nor'eastham.


We also have an Evacuation map for you. These are what the authorities use to determine who will be under evacuation orders.

You don't HAVE to evacuate, but that cop you told off before the storm may end up being the one who has to decide whether he should risk his neck to pull you out of a flood.

These maps are a bit easier to read than the Inundation maps. We only have two colors here. Red means Get Out, and Yellow means Get The F*** Out.

You should pay heed to these maps. We want you alive. We need your site visits, we have professional pride ("If they read my column, they'd be alive"), and we also want you alive for regular nice-person reasons.

"I advocate hanging on as long as possible."