Showing posts with label falmouth. Show all posts

Monday, October 5, 2015

Cheapest And Most Expensive Gas: Cape Cod Editon

Barry failed to pass the Bush Line for all-time highest gas prices, although Dubya saw lower gas prices under his reign than Obama did. Granted, they came either before 9/11 or after the economy was collapsing... Either way, a confident President Obama was happy to pose in local colors for our photographers in front of a Russian petroleum outlet during one of his recent state visits to Wareham.

We admit to spamming a lot of useless stuff over those Internets at times. You most likely won't be changed permanently by our coverage of 2 foot waves lapping up against Chapin Beach, or our visit to a Plympton pumpkin patch. I won't say we're 100% useless, because we might amuse you, but we're not really utilitarian.

Today, we plan on bein' Mighty Useful to you. We're going to go town-by-town and list the cheapest and most expensive gas prices you can find there. We're using the Massachusetts Gas Prices website for or numbers, and it's like Monday morning or something. These will be the prices reported to that site over the last 36 hours.

There may be some variation to the prices, as the price some station in Chatham is charging tourists on Saturday might not be what he's trying to run by the locals on Monday. We're just doing what we can for you, people.

Here we go:

Provincetown
Best = $2.42, Cumberland Farms, Shank Painter Rd
Worst = $2.45, Gulf, Bradford St.

Wellfleet
Best = $2.35, Wave, State Highway
Worst = $2.39, Mobil, State Highway

Orleans
Best = $2.33, Speedway (South Orleans Rd) and Cumberland Farms (Rte 6A)
No higher prices reported

Harwich
Best = $2.27, Mobil, Whip O Will Lne
Worst = $2.35, Speedway, Main St

Dennis
Best = $2.13, Mobil, Theophilis Smith Rd
Worst = $2.45, Shell, East-West Dennis Rd

Yarmouth
Best = $2.19, Speedway, Iyannough Road
Worst = $2.29, Shell, Station Ave

Brewster
$2.37, Main St, Mobil

Barnstable
Best = multiple at $2.19, on 28 and 132
Worst = $2.39, Mobil, Iyannough Rd

Mashpee
Best = $2.21, Stop & Shop, Falmouth Rd
Worst = $2.27, Shell, Nathan Ellis Highway

Falmouth
Best = $2.21, Cumberland Farms(2), Mobil, Sav-On, Johnny's Tune And Lube
Worst = $2.25, Mobil, Palmer Ave

Sandwich
Best = $2.27, Speedway, Forestdale Road
Worst = $2.39, Gulf, Route 6A

Bourne (Cape)
Best = $2.19, Gulf, Bourne Rotary
Worst = $2.29, CITGO, Sandwich Road

Bourne (Mainland)
Best = $2.12 (cash), Mobil full-serve
Worst = $2.29, Shell, Canal Road

Martha's Vineyard has the 3rd (CITGO) and 4th (Shell) worst gas prices listed on the site, $3.19 at both spots on Vineyard Haven. The worst in the state is $3.49, at a Newburyport Mobil. The cheapest gas listed was $1.93 at both Speedway and Prestige in Brockton.


Sunday, September 27, 2015

Scallop Festival Blues

Fiendishly Foisted Food Fest!  


Last weekend brought us the annual Scallop Festival, with all of the prestige and revenue that accompanies it. It really is nice to see our old friend return to... What do you mean, not Bourne???

The people who run the Scallop Festival- the Cape Cod Chamber of Commerce- decided that the event needed a larger venue, and shifted it to the Barnstable County Fairgrounds. The move gives the festival more parking, better facilities, and dare I say a more prestigious locale. The event has swollen in popularity, to the point where it draws in 50,000 people every time they throw it. A larger facility means the chance of more money. It makes perfect sense to move the event off the mainland.

Bourne's claim to the Festival had a fingertip grip at best, buffeted by hopes of a new hotel complex, the arrival of the Commuter Rail, and the revival of the Main Street business district. There was also a nostalgia/historic basis, but that isn't worth a few thousand parking spots these days.

The move also gave a stomach punch to a struggling village, a village that has stood by the Festival for her whole existence. The Scallop Festival has been going on for 45 years. Sometimes it was in the Armory, sometimes in the big tent by the old Playland location, sometimes on the military base, and- until now- in Buzzards Bay Park.

It is was a Bourne tradition. Now, the town is losing their Main Event, the annual gift horse that would fill the hotels, buy out the goods from our stores, and put our gas stations on a paying basis.

Who knows? Some of the people who visited Buzzards Bay during the Festival may have liked it enough to maybe return again and spend more money. We'll never know now, will we?

All summer long, people heading to spend money in other Cape Cod towns clutter up Bourne during any time period you can hang "commute" off of. We're asked to deal with it, so that Eastham and Martha's Vineyard can prosper. We get very little in return for it, other than some people who tire of the traffic enough to pull off of the highway in search of food or gasoline.

The Festival has always been a sort of the last hurrah for Cape Cod's summer, especially when the event coincided with the October scallop harvest. It was fitting that Bourne got the final bow with her Scallop Festival. We took the brunt of the hassle all summer long, so it was only right that we got the last bite out of the tourists before the desolation of winter set in.

The festival was kind of like a Thank You from all the people who had been leaning on Bourne during the peak traffic season, and the town was dependent upon it. Now, they take even THAT away from us. Oh, well, there will be another Canaliversary in 98.75 years, I guess we'll be OK.

Others are not so forgiving. Homeland Security has been tracking a group called Al-Mollusk, who were planning to disrupt the Faux Falmouth Festival. They had an elaborate plan to buy junker cars and use them to block the Bourne Bridge during the festival, depriving Falmouth of anyone Inland while seeing how many Cape Codders will travel through a mob to get scallops and fries.

The town considered her own measures. The big idea was to host an Oyster Festival on the same night. Advertising was to focus heavily on the aphrodisiacal properties of the Oyster, while disparaging the scallop scarfer. "You can go to the Scallop Festival, but if you still love your spouse, you'll be in Bourne instead."

Yeah, we were gonna go right for the friggin' jugular, you really have to these days.

Bourne took it on the chin with this Scalloping of our tradition, and we should already be planning our revenge. If this were the old days, we'd be sending guys across the bridge to burn down their salt mill and deflower their virgins. Those people are lucky that I don't run Bourne, I'd drop those two bridges into the water faster than you can say "Jackie Robinson." I'd try to steal their stupid Road Race.

I can tell you this.... you won't be seeing many people from Bourne down at the Fairgrounds this weekend. It's never nice to see your ex with someone else, especially if they are being fed shellfish.


Thursday, September 17, 2015

Falmouth Hurricane Information Special


Falmouth holds a corner lot on Cape Cod, facing both Buzzards Bay and Nantucket Sound. You never want to have multiple county-sized bodies of water looking to push ashore into your town when a storm comes, which leads us to today's topic of discussion.

We have two maps for you to analyze with your friends and family. The map above is a Hurricane Inundation Map. It comes from FEMA, MEMA, NOAA and NHC, will be written about by ME, and read by U.

"Inundation" is a fancy word for "storm surge," which are two fancy words for "water pushed ashore by a storm." This is the killer in a storm, it's what did in New Orleans 10 years ago, and the maps give you several views of it.

You can see where water will come ashore in a direct hit hurricane arriving at high tide, and you'll see what degree of storm (via the Saffir-Simpson hurricane intensity scale) will flood different parts of town. They are based on the zany-weatherman-titled SLOSH model of storm surge inundation.

These maps do not project freshwater flooding things like rain, overflowing rivers and sewer backups, as well as people just spraying the hose into the street for the hell of it, mid-storm, because Falmouth is a hardcore sort of town.


Light Green = Category 1 hurricane. The Blizzard of '78 and the Halloween Gale are good examples of Category 1 storm damage, although neither was directly a hurricane. If those didn't hit hard down there (I'm a Duxbury kid, and was on Duxbury Beach for '78 and '91), use Hurricane Gloria as a hits-at-low-tide benchmark.

Dark Green = Category 2 hurricane. Hurricane Bob was a weak Category 2, and yes we do realize that "weak" and "Category 2 hurricane" are odd words to chain together.

Yellow = Category 3 hurricane. We've only had five storms of this strength hit New England since the Other Man arrived in 1620, the most recent being Carol in 1954.

Pink = Category 4 hurricane. We've had one in recorded history, in 1635.

Flesh = 100 Year FEMA Flood Zone. This is the "hundred year storm" you hear about, although you have to go pre-Colombian to find them. New England was hit by storms greater than Category 4 in roughly 1100 AD, 1300 AD and 1400 AD. They can tell by checking layers of sand on salt marsh muck.

Sorry about "flesh," my knowledge of colors was greatly dictated by the people at Crayola in the 1970s.


You can check these maps in far greater detail by going here and zooming a bit. It's disaster porn, styled to your very home!

Again, these maps do not depict freshwater flooding, and freshwater flooding will cause a whole slew of problems on her own if a hurricane says "Wuzzup?" to Wood's Hole.

Remember, you don't have to get flooded with seawater to die in a hurricane. You can get hit by lightning, sucked into a river, mashed in a road accident, have a tree fall on you, step on power lines, stumble into a sharknado or be killed by looters.

These maps show you what dangers face your particular house, and you can use them to decide on whether to make a run for it or not.


We'd also advise you to chat up the oldest guy with the longest residency in your neighborhood. Find out what Carol did to the house you live in now. Find out how high the water was in the street, how long the power was out for, what roads become impassable, and any other k-nuggets of knowledge the old fella might have.

Cranberry County Magazine stands strong behind our philosophy that your hurricane preparation planning is incomplete until you talk to some white heads. Your neighborhood's Old School is an asset which should not be underutilized.

FEMA and GRAMPS may hold differing opinions as to when you should flee, but FEMA most likely wasn't living on your street in 1954 when Carol came ashore. Gramps was. If he says your street floods and FEMA doesn't (my own neighborhood floods in nor'easters, but FEMA gives it Category 4 status), you may want to do some serious merit-weighing when deciding if you should Get To Steppin'.

This leads to our second map style, the Evacuation Map,

This is the map the authorities use when determining which neighborhoods will be evacuated. You don't HAVE to leave when the police tell you, but you also want to remember that the cop you were reading the Constitution to before the storm might very well be the one who has to make a decision as to whether or not to dive in to the maelstrom after you and your family.

I'm not chastising you. I watched the Halloween Gale from a waterfront home, with the police on a nearby hill blasting a searchlight on us the whole time.

Of course, that was a stupid move, so we'll work the other side now, and tell you about Feets Don't Fail Me Now, Heading For The Hills, and Running Like A Scaled Dog.

This map is easier to follow. It has two colors:

Pink = They have to evacuate.

Yellow = You do, too.

Here's the Evacuation Zone map:


Hurricane Inundation Maps

Evacuation Maps

Worst Hurricanes To Hit New England

List of all hurricanes to hit New England


Saturday, August 15, 2015

When The Levee Breaks...

(Editor's Note: This article is from about 5 years ago, we diggin' in the crates...)
The Boston Globe and Google Maps are doing a cool service with this map of Massachusetts seawall conditions. Clicking on the individual areas lists the location and repair costs. Every seawall pictured on that map would cost $160 million to repair.
You can see the real thing here at the Globe, but I took the liberty of pasting a few shots of local areas for educational purposes only.
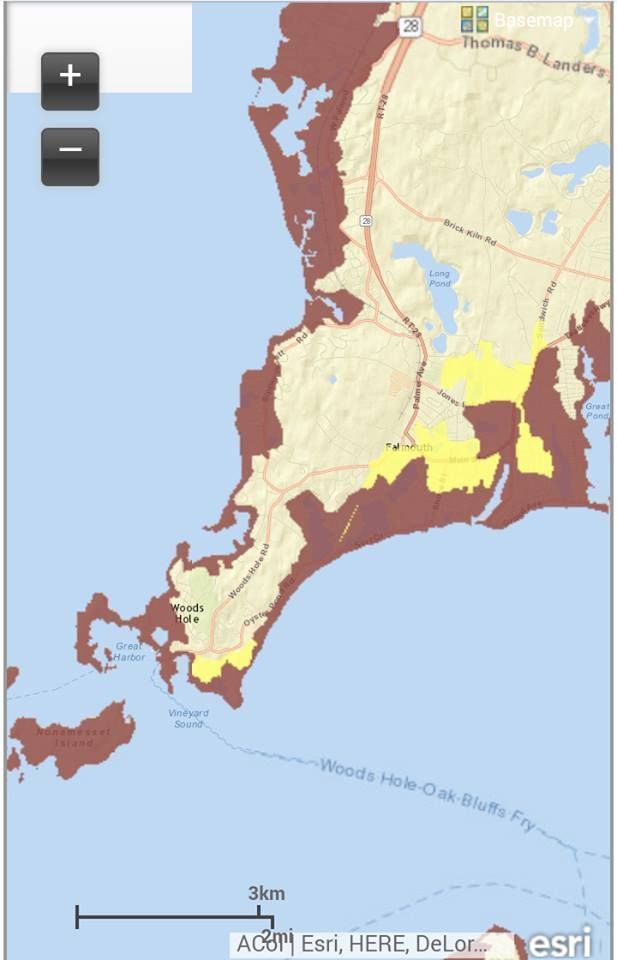
The map shows who has seawalls. The color code is basically Green meaning high quality,Orange meaning poor and Red being critical/non-existent.
The Outer Cape has her own seawall, that being a mountain of dunes. They were what Massachusetts defended herself with before the people era. Anyhow, that's why there are no seawalls of any note on the outer Cape.
They didn't have any info on Nantucket and Martha's Vineyard. I'm sure there are some localized seawalls, at least.
Note that the lower Cape seawall system is designed to stop hurricanes, while the South Shore's is designed to stop nor'easters. That's not 100% exclusive, but it's a good rule of thumb.
Falmouth is heavily sea-walled, and another strip runs off and on from Yarmouth to Chatham.
Seawall repairs are costly. Provincetown alone needs $5 million in seawall repairs. We're coastal people, and we have coastal problems. Things will only get worse if that global warming/sea level stuff is true.
Barnstable is very much unprotected by seawall, so they at least may get to dodge some of this Cost Bullet. They may be penny-wise and pound-foolish, but time will tell.
I'm no expert on the Cape's specific coastal areas, so I'll leave it to you to draw your own conclusions. If you have your own observations, leave them in the comments section.
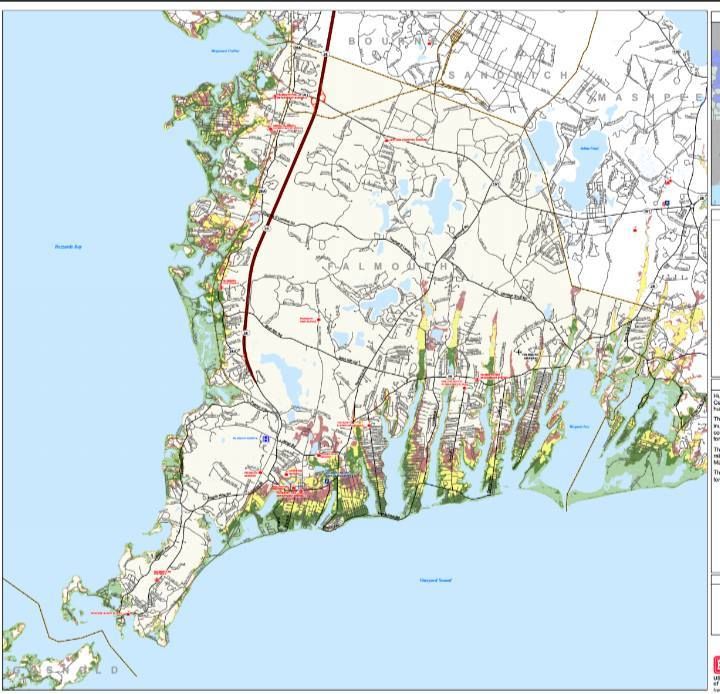
I did some zooming, and isolated the two wall-iest areas of Cape Cod.... Here's one of them, the Falmouth/Bourne/Sandwich/Onset area. Everything on the map below would cost about $50 million to repair.
Falmouth is obviously prone to terrible tides, and the extensive seawall construction speaks volumes. The areas of Bourne and Onset were devastated during Hurricane Bob, right about where that hurtin-for-certain seawall is.
Much of that seawall is in need of repair. Those repairs will be costly. $50 million dollars = costly. Those repairs are small change against what losing miles of beachfront property would mean in taxes and tourism.
Estimates include seawalls, jetties and anything else armoring the coastline.
The run of seawall that goes from Bourne Pond to Jeweler's Road in Falmouth adds up in several increments to equal $3 million in necessary repairs if you throw in the nearby Eel Pond seawall. 
The seawall on Ocean Avenue to the Great Pond area of Falmouth needs $3 million in repairs.
Falmouth Heights needs $4 million in seawall repairs.
Lewis Point in Buzzards Bay needs $500,000 in repairs.
Onset is looking at $1.5-2 million in repairs
Here's the Yarmouth-Chatham run... price tag: $36 million or so.
Red River Beach in Harwich to Cockle Cove in Chatham needs $1.5 million in repairs.
Wychmere Harbor needs almost $2 million in seawall repairs, as does West Dennis Beach.
A series of seawall repairs from Parkers River to Beachwood Avenue in Yarmouth will surge well past $2 million.
Town Fish Pier In Chatham needs $500,000.
I'm not sure if the Wampanoags built seawalls. Native Americans tended/tend to be more reasonable than Europeans, and most likely just didn't settle dangerously close to the beaches.
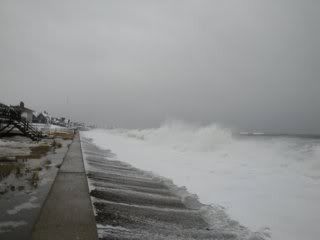
The picture below is my hometown, Duxbury Beach. I'll focus on it because A) I'm very familiar with it, and B) I have some pictures of it. It runs from the Gurnet Road area of Duxbury to Green Harbor.
The seawall shown via the stripes of different colors protects about 1-2000 people, depending on the time of the year. The Southern half is sparsely populated, making up maybe 3-500 of the total figure even in the summer. The seawall repairs will cost well over $6 million, mostly to the north (and some of which is off the map), in Marsh Vegas.
The red area on the map is a football field-sized gap between the Duxbury seawall and the Marshfield seawall. The Globe reported that there was wall there at some point that has disappeared, but no wall has been there since the 1960s. I'll ask around, but no one I know can remember there being seawall there.
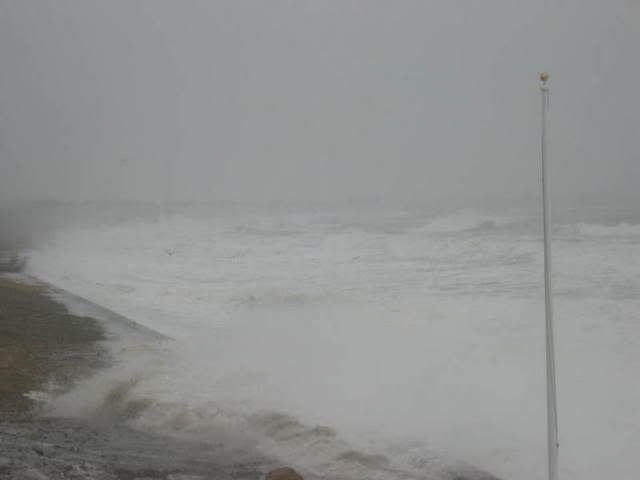
The seawalls were put up in the 1950s, during a hurricane run that gave us Edna and Carol. The seawalls allowed coastal development in an area that was devastated during the 1938 Hurricane and the 1954 sisters.
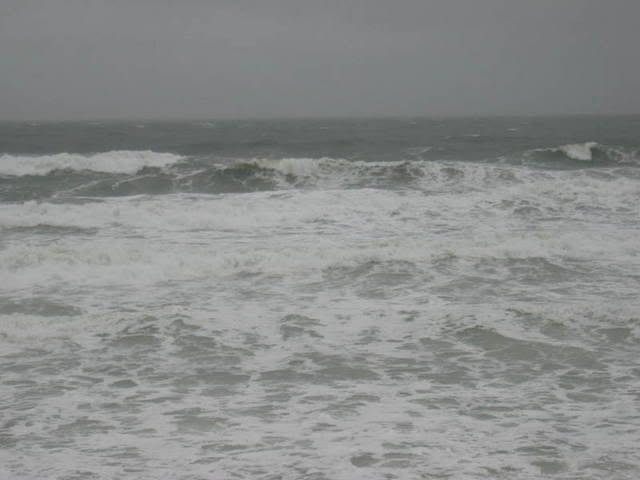
The seawalls suffer from cracks, crumbling, collapse, erosion and other ailments. The seawall shown putting in work at bottom of the article is from this area.
The green area is where I'm from, and the seawall is just a big slab of concrete. It does the job we ask of it. The neighboring orange area was a portion of the wall (near the old Gurnet Inn) that had started to fall forward. The US Army Corps of Engineers is in charge of repairing the wall, and they dumped tons of boulders against it to arrest the Tower Of Pisa act.
The orange wall in more northern Green Harbor is much "taller" (more of it is exposed, where down-beach Duxbury gets a lot of sand washed up against it) than her sister to the south. Almost the whole length of it requires boulders be shoved against it to keep it from tipping forward. The houses are built right up to the seawall in many cases there.
The extreme top/north of the picture features two giant jetties, made out of piles of boulders, that protect Green Harbor.
Regarding the cost of seawalls, the old divorce joke works pretty well.
                                        Why do seawalls cost so much?
Because they're worth it!

Monday, July 27, 2015

Barnstable County Fair 2015

This year's Barnstable County Fair was a blast. There were many things to do and see there. It was nice to see some returning vendors and acts and also nice to see new ones, The Barnstable County Fair is located in Falmouth Massachusetts (Cape Cod, MA).

The BCF has been coming to town since 1844. It was originally a livestock/crafts sort of fair, and that is still a big part of the show today. They didn't have electric ferris wheels or anything like that back then, maybe they used horses or something, I have no idea. The big draw early on was the merry-go-round.

Other than a brief shutdown during WWII, the fair has been going strong ever since. They have since incorporated spectacuar rides, and have brought in performers and other acts.

One of my favorite acts was Wacky Chad with his Pogo stick tricks. He has been on America's Got Talent... twice!


The animals and petting zoo have always been a nice thing to look forward to. This cow is trying to go viral, I saw him practicing that look in front of the mirror before I shot.


Who wouldn't want to feed a goat or a yak out of the palm of your hand? 


If you were at the the fair you may have noticed the baby animatronic T-Rex. He was about half-done eating this old guy when I asked him to pose for me.


The Three Dog Night performance was spectacular, my phone's video recorded it in poor quality. I guess you'll have see them in person to get the real deal. We were so close to the stage that we could feel the beat through our entire bodies. I was so psyched to see them perform in person. Their hits include: "An Old Fashioned Love Song" featured in the video below, "Joy to The Word," "Shambala" and many, many more.


We can't forget about the rides and the amazing view of the fair from the Ferris wheel. 


I saw a little bit of the Lumber Jill's Performance - wish I had a better view (I was too short to see over everyone else). And I was really hoping to see the Willis Clan

But overall, this years fair was awesome.