Our aim today is to rank the beaches of Southeastern Massachusetts for Coastal Flooding Vulnerability.
There are several things that you should know before you dive into this pool. For starters, this is the second time that I have written this article. The first time I wrote it, just explaining the rubric I'll be using took about 15000 words, and that was before I even started ranking the towns. Jessica had the fine idea of working the rubric into the town descriptions as I rank them, and that seems like a pretty good space-saver.
Secondlyish, remember that our major flood risk on the South Shore comes from nor'easters. If you add hurricanes to the list, it suddenly becomes Cape Cod and South Coast-dominated.
Also, know that there is no clear winner for this. Duxbury, Scituate and Marshfield can all make a legitimate claim on the top spot. Duxbury Beach, parts of which are severed from the rest of Massachusetts now and then, has the worst conditions (we'll explain in a minute), but the other two towns have heavily populated shorelines.
Because of that, we're going to sort of group towns of varying threat levels. More on that in a sec...
We're not claiming the title for the state. The North Shore is also a stormy place. We're just gonna leave those beaches for some North Shore blogger. While we plan to annex Bourne and Sandwich for this discussion, they'll go back to the Cape for the Barnstable County version of this article.
Finally, know that we are using town-by-town rankings. There are many good reasons to break things up neighborhood-by-neighborhood. Great and potentially dangerous differences exist between how Duxbury Beach suffers in a storm and how Duxbury's Powder Point neighborhood fares.
However, going by neighborhood would give us a boring Top 10 of Duxbury Beach, 4 Marshfield neighborhoods and 5 Scituate ones. Also, if you think this article is long, imagine one where I have to differentiate between maybe 35 different beaches in a dozen towns.
Ranking-by-town takes the onus off of your author, who grew up on one beach and is an expert on that one beach, and instead will let residents of various neighborhoods fight it out in the comments section about whether Peggotty Beach gets it worse than Minot does.

RANKINGS
Again, the rubric I use would take all day to explain.
Highlights include beach length/width, population, past damage, loss of life, barrier beaches, behind-the-beach wetlands, orientation, development, wind direction, storm strength, latitude, longitude, offshore rock formations, jetties, groynes, currents, dual frontage, property values, media coverage, breaching, erosion, sand dunes... you know, the whole nine.
I've put as much thought into this as anyone has, and it seems like you can break the beaches up along three threat levels. Major, Moderate and Minor.
They go a little something like this:
- If your waterfront house doesn't need a seawall, you're Minor.
- If your waterfront house has some flooding issues, you're Moderate.
- If you stand a chance of being killed in your waterfront house (during a storm, of course)... Major.
I'm resisting the urge to try some Foxworthian "If a live fish has ever washed into your house, you might be in a Major coastal flooding community" jokes. You're welcome.
We realize that Minor, Moderate and Major are boring, so feel free to use some other more amusing trinity if it pleases you. Parish/Bird/McHale, Original/Extra Crispy/Grilled, Stink/Stank/Stunk... whatever you're into, people.
MINOR

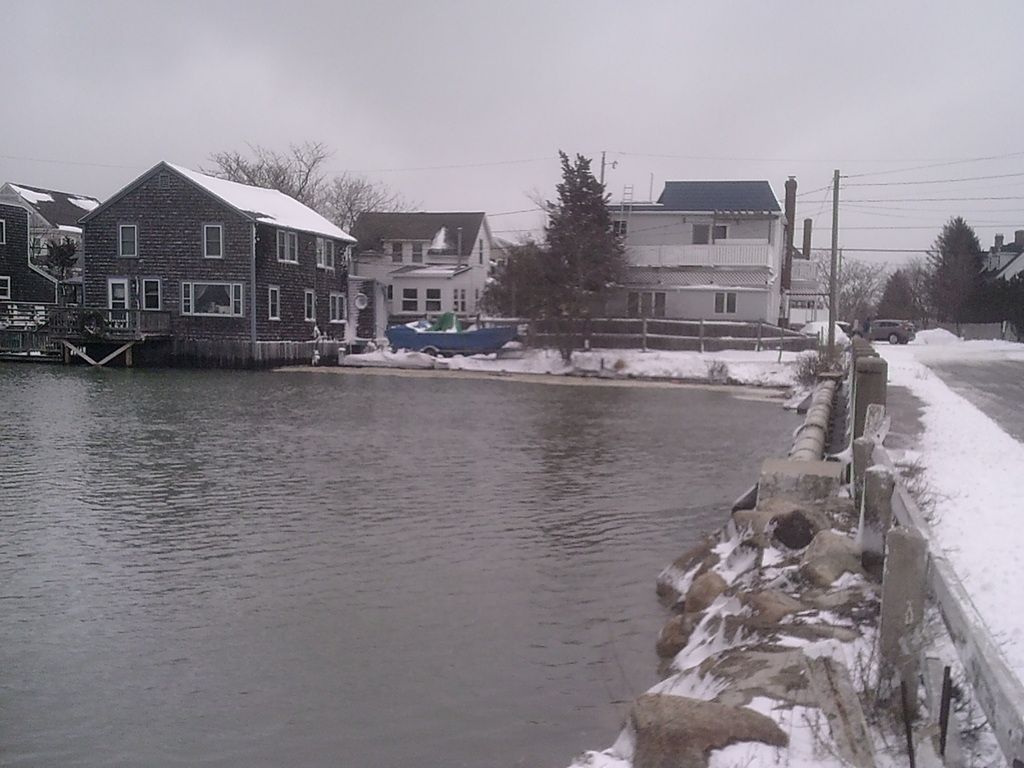
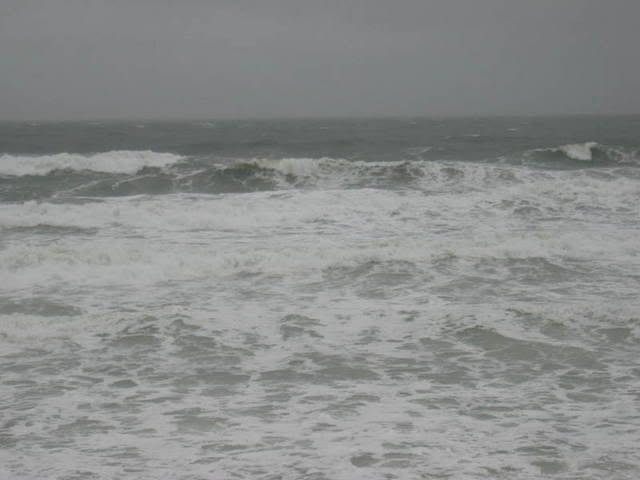
KINGSTON
Kingston enjoys a cushy spot on the South Shore, tucked into a cove and sheltered by three barrier beaches. Two of these barrier beaches- Duxbury Beach and Long Beach- are small. The other one- Cape Cod- is not.
Kingston can suffer storm damage, but it will always be exponentially smaller than damage suffered by her barrier beaches.
Kingston is by far the southernmost town on the Mild list. Almost all of the other Mild towns are sheltered by Hull. Kingston stands alone here.
To be fair to Kingston, part of the decision to have her be last in the rankings is that she is the Mild town for which I have the coolest picture.
WEYMOUTH
Weymouth has an itty-bitty shoreline, hidden behind the blind side protector that is Hull.
She may even hold the very bottom ranking, except that she has the Fore River,and that can amplify flooding a bit.
One wonders if the Fore River was named by a golfer. If the Blues Brothers movie was set in Massachusetts, Elwood would have almost certainly jumped the Fore River drawbridge while Jake was throwing the cigarette lighter out the window.
Via the Fore River, she exemplifies the vibe you'll see several times on the Mild list... she doesn't have much trouble, but when she has trouble, it's Big trouble.
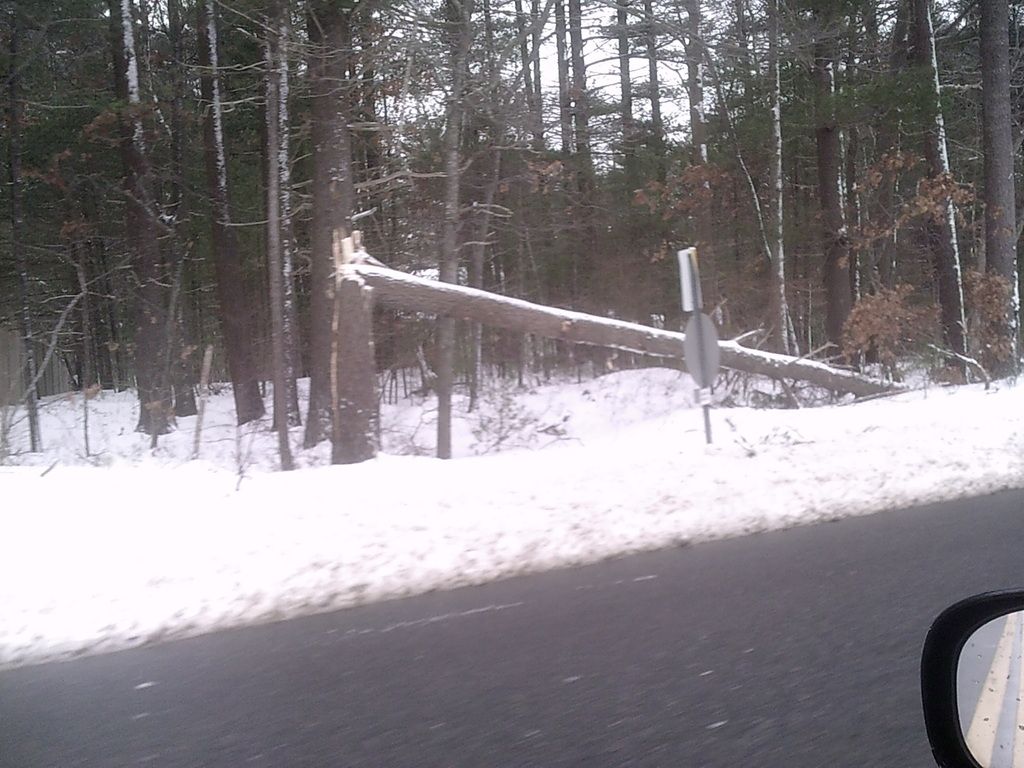
HINGHAM
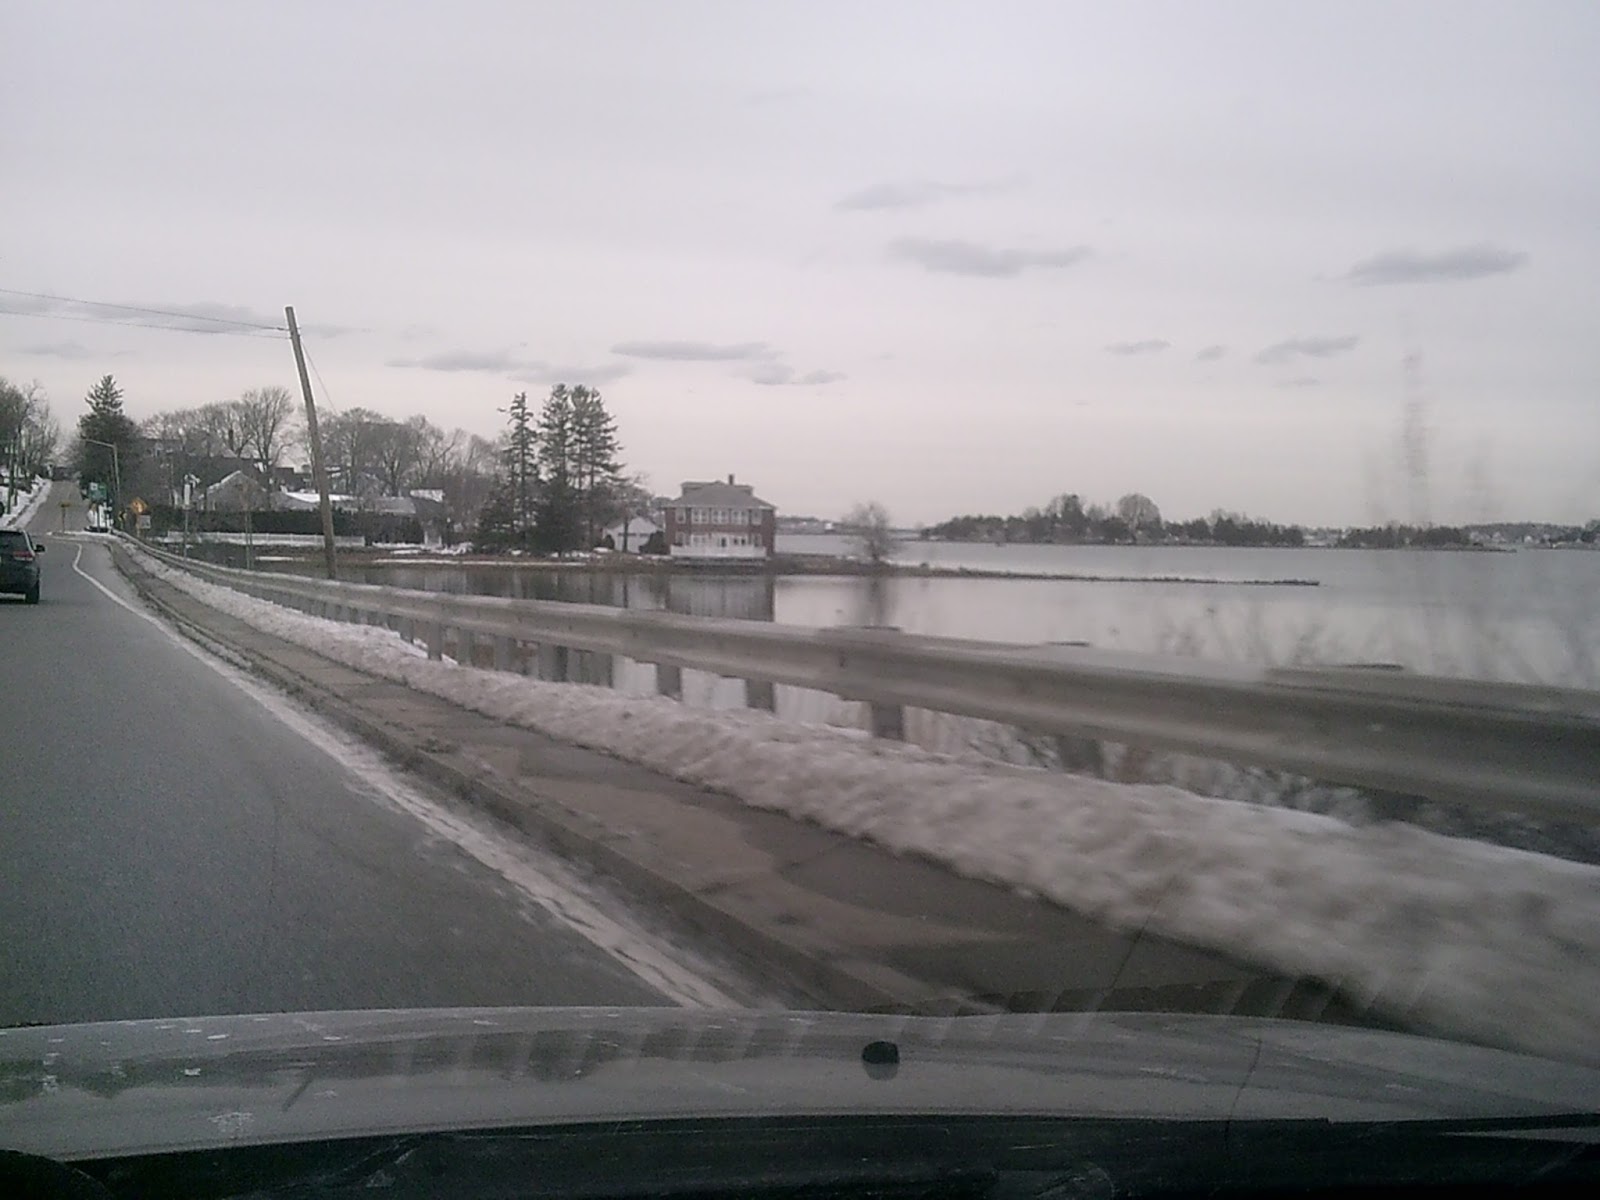
Weymouth stands behind Hull. Hingham, on the other hand, is literally hiding in Hull's skirt. Aliens viewing Massachusetts from space would think that Hull was built to protect Hingham.
Hingham is on a bay, so there is some flood risk, but it is minor when compared to what would happen to a Brant Rock or Town Neck Beach during the same storm. She's far enough north that some storms miss her entirely.
Hingham looks very much like a t-shirt when viewed on a roughly-drawn political map. I just wanted that on the Internet somewhere.
Hingham's flood risk is low enough that, as you can tell, I shot my Hingham photograph while zipping through Hingham at 45 MPH on my way to Nantasket or somethin'.
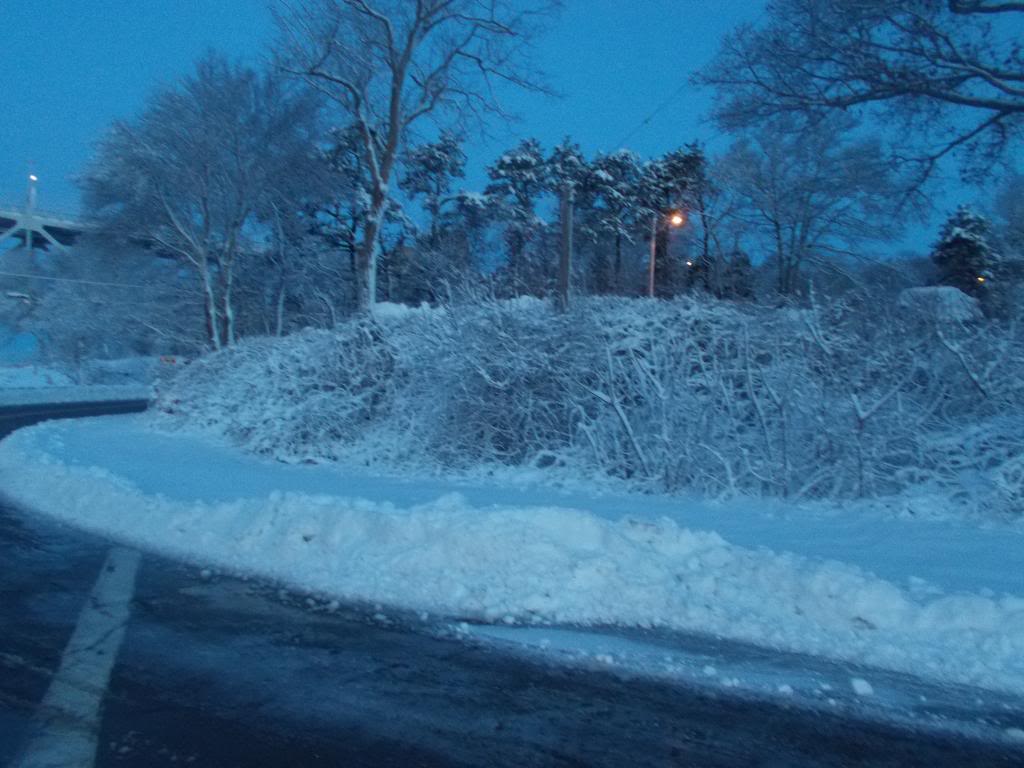
QUINCY
 |
| Not Quincy (it's Green Harbor), but Quincy has shoreline, trust me) |
Quincy is a unique fish, in that if you draw straight line X from Weymouth's coastal border with Quincy to Boston's coastal border with Quincy, you'd use about one third of the ink that you'd need to use to draw the actual X-times-three twisted shoreline that Quincy claims between Boston and Weymouth
Quincy has a pincer-shaped coastline that funnels water towards the middle, a much milder version of Bangladesh. The pincers are made of heavily-populated areas.
Why aren't they in the Moderate group?
Quincy is a sheltered bay town. She has Hull and, to a lesser extent, Winthrop blocking for her. She also has Boston Harbor islands which break up the surf somewhat. She's the northernmost town on this list, which means that storms which clip the South Shore with their northern fringe may not touch Quincy.
Quincy also came up on the losing end of the "Should densely-populated Quincy be scored more for moderate storm damage than southern Duxbury Beach (population: zero) is for worse damage?" argument that the authors had while constructing our rubric.
COHASSET

Cohasset is the least likely town to be on the Mild list when you're looking at a map. She has plenty of shoreline, has no barrier beach in front of it, and claims coastal-flooding heavyweight Scituate as her next-door neighbor.
Cohasset "loses" on intangibles. She has a rocky shoreline ("Cohasset" is bad Algonquian for "long rocky place"), Ledges and rocks/rockpiles lay offshore, breaking up waves. Although she's considered South Shore, her northern border lays about on the same longitude as Boston. That keeps her off the fringes of a lot of storms.
Cohasset even sits higher than her neighbors do, usually on a bunch of rocks. She has a more Northerly bearing than Scituate does, which means that she is most vulnerable to the lesser storm winds.
Cohasset comes up with the short straw when arguing about "Should a town where some 5th generation slacker who is barely holding on to his damaged Humarock cottage be scored worse than a wealthier town where homeowners who suffer damage just go to one of their other houses?"
MODERATE

BOURNE
Bourne and Sandwich are being borrowed from Cape Cod for this article, because they each have unique coastal flooding characteristics that will come in handy when describing Massachusetts coastal flooding scenarios.
For starters, Bourne is the only town which has Canal Flooding as a factor in her own personal rubric. Canal flooding seems silly, until you talk to people who were alive in 1938 and recall houses washing down the Cape Cod Canal with families inside trying to claw their way out of the attic ceiling.
Bourne, which doesn't suffer major nor'easter damage when compared to a place like Duxbury Beach, does have the unique distinction of being the only town in Massachusetts which touches both Cape Cod Bay and (the body of water) Buzzards Bay. That exposes them to both nor'easter damage and hurricane damage.
Remember, a two-front war is what did Hitler in. Bourne has been Poseidon's punching bag many times before. Heavyweights on this list like Duxbury and Scituate were barely touched by Hurricane Bob, while Bourne was torn to shreds.
When we start mixing hurricane damage vulnerability into the rubric, Bourne jumps up from Moderate to Major and shoves aside Duxbury and Scituate to claim the top ranking. In that regard, they may even be in a class by themselves.
However, the mojo of these rankings is more Nor'easter, and this drops Bourne down a weight class.
SANDWICH
Sammich also has a problem with coastal flooding that could, eventually, push her into the top part of the rankings.
The Cape Cod Canal, which helps everyone out, requires a huge jetty at the Cape Cod Bay end to keep sand from washing into the Canal and beaching ships. The idea works so well that Sandwich beaches are suffering Sand Depletion. This occurs when sand that would normally wash down the South Shore and replenish Sandwich beaches instead fails to get around the jetty and subsequently makes Scusset Beach very nice.
The problem is compounded when ol' Mr. Storm comes along and washes the Sand out of Sandwich. I don't even know where it ends up, but it's never good when your Sandwich gets smaller every high tide.
The process works in such a manner that even simple logic- use the sand that you dig out of the Canal when you dredge it to replenish Sandwich beaches- is foiled when the storms wash all of the new (to them, anyhow) sand away.
The Scusset jetty also takes away the ability to build jetties in Sandwich... you can't trap sand that isn't coming, even if you have Sand in your name. I'm told that this is why the Sandman lives inland.
This is a Major list sort of problem, but Sandwich is also has Cape Cod blocking her NE wind waves. She does get pounded by nor'easters, but generally it is the latter, north-wind sections of them. Much like Bourne, this knocks them down a letter grade.
To be fair to Sammich, note that they fit my listed condition (no seawall) for Minor status, but their unique problem with shifting sands moves them up a tax bracket. It is tough to keep them out of Major, but Moderate is where they stand.
HULL

H-U-Double-Hockeysticks has it all on paper. They are the barrier beach for Hingham, Weymouth, Quincy and even Boston. They are thrust out into the sea like some strange and sandy phallus. They take big hits from the ocean, and are close enough to Boston to possibly enjoy a bigger storm reputation.
I give them extra points for having one road out of town, and even more points for the ability of that road out to be flooded over in spots.
Hull appears very much like God wanted this section of the Massachusetts coast to have bookends, as Hull looks sort of like an inverted version of coastal flooding heavyweight Duxbury Beach.
Hull has three factors keeping them in Moderate status.
First, they are very rocky.
Second, they enjoy relatively high elevation above sea level in some of the more vulnerable spots.
Third, they are far enough north that they miss some of the fringe coastal storm action.
They do have, to my knowledge, the best football field in Massachusetts (and, therefore, probably the world) to watch a game at during a nor'easter.
PLYMOUTH

America's Hometown is huge, and has a shipload of coastline. It was large enough in 1620 that the Pilgrims managed to hit it sailing from Europe.
They have Cape Cod blocking for it, and that saves them a lot of storm damage. That's why they're in the Moderate category, player. If you want to know how much wind and wave damage you gain or lose by having Cape Cod between you and an ocean storm, the difference is about Scituate vs. Plymouth.
A good section of town (and a major business district) is protected by a lengthy barrier beach and an intricately designed jetty. The rest of the town is guarded by more jetties, groynes and so forth.
They do have some problems. I spent most of my Physics class in high school looking at legs, but I did face the chalkboard enough to pick up that Potential vs Kinetic energy stuff. Cedarville has a few dozen houses perched on sand cliffs 100 feet above the ocean. The ocean, even with a Hawaii 5-0-style tsunami wave that would kill 100000 Indonesians, can't touch these houses... yet.
Storms only damage sand and beach grass right now on Cedarville, but I would be very, very remiss if I failed to gauge the "sand cliffs slowly erode, and houses set on them will some day plunge 100 feet straight down into the ocean" factor into my judgement.
Plymouth is also the only town in the region with a "I wonder if the coastal flooding will reach our oceanfront nuclear reactor?" problem.
Note that Gurnet Point/Saquish are part of Plymouth politically, but they are geographically part of Duxbury Beach. This classification by the editor (Hi!) lowers Plymouth's rating while not raising Duxbury's.
MAJOR
MARSHFIELD
Marsh Vegas, Deluxbury and Skitchate are sort of 1A 1B and 1C in our rankings. You can make an argument about top rank for any of them, and against any of them. If you demand a numerical ranking, I'd give Marshfield #3. The gap between #3 and #4 is substantial, however. The gap between #3 and #1? Not so huge.
You may have seen Marshfield in action on the TV set during last year's blizzard(s), which tore through the seawall and wrecked a few houses. That's the kind of action that breaks apart the Moderates and the Majors.
Marshfield has 5 miles of coastline, some of which (Rexhame) serves as a barrier beach for other parts of the town. Sexy Rexy is also one of two Moraines (glacial deposits of sand and stone laid out in a straight line or something) on the East Coast that serve as a barrier beach. Marshfield, which deserves it, has the most Jetty action on the South Shore, to my knowledge... although I think that Plymouth has the biggest individual jetty down by Issac's.
Marshfield has it all, a perfect town with which to lead off the Major part of the rankings. Direct northeast frontage? Check. Far enough north that Cape Cod doesn't block for it, but far enough south that storms hit it? Check. Heavily populated immediate shoreline? Marsh Vegas is jammed along the coast.
Every beach in town (Rexhame, Fieldston, Sunrise, Ocean Bluff, Brant Rock, Blackman's Point, Blue Fish Cove, Burke's and Green Harbor... if Wikipedia missed one, let me know in the comments) has been smashed by surf. They are even drawing TV news crews away from Scituate, which is important because Media Swagger matters to me when I do the rankings.
What keeps them from owning the top spot outright? For one, the worst flooding you see in Vegas (the Esplanade area, home to the former Arthur & Pat's) is splashover. Up until last winter, I had 40+ years of living in that area where seeing a house get wrecked was a rare event.
The shifting of the sands (Marshfield beaches are fed by the erosion of Scituate's sand cliffs, and replenishment has been blocked somewhat by the storm-breaking jetty system Marsh Vegas employs) has left Marshfield with higher-than-average seawalls. This helps, in that it takes larger waves to get over it, and hurts, in that the base of the seawall can be exposed. This leads to- as we saw last winter- catastrophic seawall failure.
Still, Vegas is nothing but Major. Don't you worry... anyone who says otherwise has to fight me first. Unfortunately, the "don't you worry" part also is intended for whoever has to fight me. I'm a big softy.
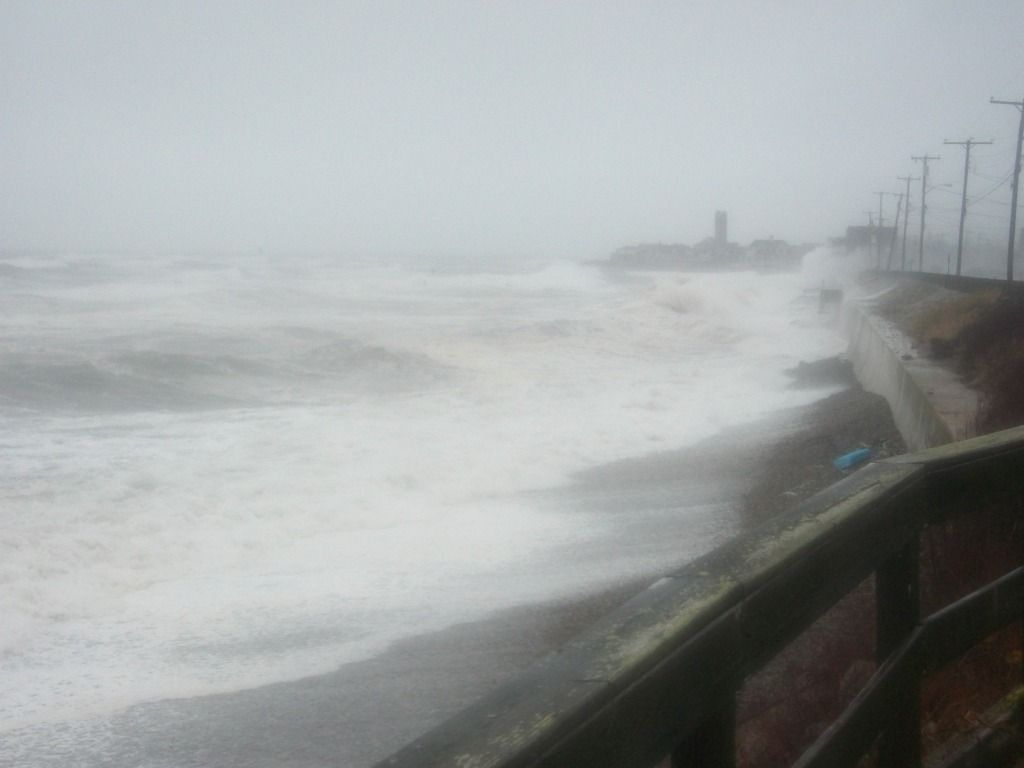
SCITUATE

"Scituate" would be almost everyone's immediate answer for the "Who gets the worst coastal flooding conditions?" question.
Scituate owns the news coverage for nor'easters. I bet that Shelby Scott still has nightmares based in Scituate. The sea screams out of every picture you take along the coastline. The town name even looks nautical, dog. To the seasoned observer, however, this coverage is why the Scitty By The Sea doesn't have the top spot... the news crews can get to Scituate in a storm.
More than one person (or maybe it was just me doing it more than once) has noted that only the Irish and Italians have the Catholic tendency for self-punishment necessary to build their Irish Riviera right smack in the middle of Nor'easter Alley. I'm as Mick as a Sinn Fein holiday party, and I actually look forward to these storms.
Scituate (and Marshfield to a lesser extent) was never even considered for anything but Major status. People have- allow me the use of the double adverb relatively recently- died in Scituate during coastal storms. If you buy a house in Scituate, and if a storm wrecks it, people will look at you like you're a damned fool if you complain about it. "Seriously, guy... what did you think was gonna happen?"
I actually went to Scituate's Facebook page to try to get the residents fighting each other over which beach in town gets beaten up the worst in storms, but I posted at a bad news time and got little action on the matter.
Scituate has a lot of coastline, and much of it precarious. Humarock, which lot of people think is part of Marshfield, is actually a part of Scituate that was split off from Scin Scity by the Portland Gale of 1898, a storm which actually shifted the mouth of the North River.
Other parts of town (Minot, Peggotty Beach, etc...) may ring a bell with you, mostly from local news nor'easter coverage. They all get punished during even minor nor'easters like they were kids from an Adrian Peterson/Joan Crawford tryst.
Either way, if you make your own list and have Scituate at the top, I really wouldn't argue that much with you. She has earned every one of her stripes.
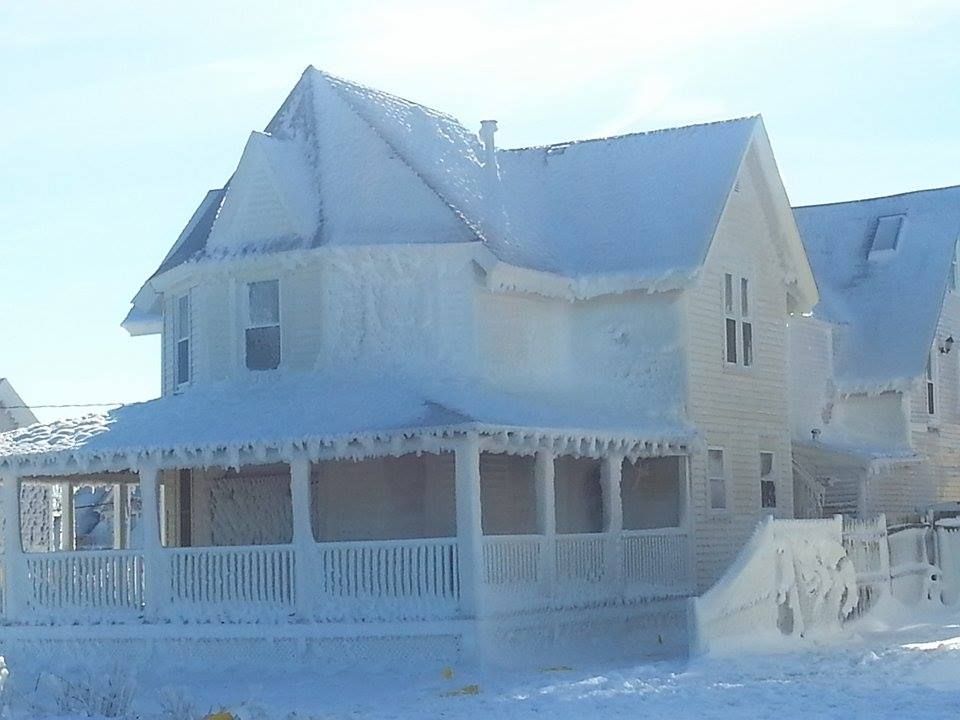
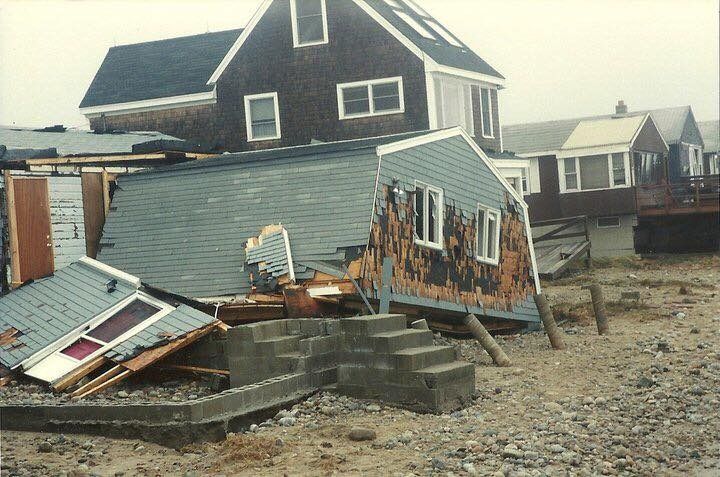
DUXBURY
 |
| Photo from the girl who used to own The Fairview, I forget her name... |
However, if a Scituate or even Marshfield supporter came to me and said "I think that the rankings should be more biased towards towns with heavily populated shorelines," I'd tell them that "You would then need to put Scituate or Marshfield at #1 and maybe drop Duxbury down to Moderate."
Duxbury has several factors that otherwise make her the worst spot in Massachusetts for coastal flooding.
- Duxbury Beach gets torn from the mainland a lot. She is presently attached to the mainland only because a convoy of about 100 trucks a day for 6 months dumped sand to fill in the beach breach that went down during the Halloween Gale.
- Duxbury has a 6 mile barrier beach which suffers ridiculous damage, but much of the remainder of the town is also exposed to coastal flooding... albeit of a far lesser ferocity. Duxbury's coastline after/inside of the barrier beach suffers Hingham-style storm damage. Shes the only town on the South Shore to get interior coastal flooding a mile or more back from the barrier beach.
- There is about one (1) patch of trees on Duxbury Beach with which to moderate storm winds.
- Duxbury has a very short seawall when compared to Marshfield. Duxbury gets all the sand that washes out from under Green Harbor's seawall. You can step off of Duxbury's seawall without breaking stride now and then, and even the highest height that the seawall gets from the beach is about half of the lowest height that you'll see in Marsh Vegas.
- Duxbury Beach has a giant marsh behind it. Since many storms hit during a full or new moon tide, this means that Duxbury Beach lays between a mile of flooded marsh and the fury of the angry Atlantic. Duxbury Beach neighborhoods often flood during full moon tides even without storms.
- Because of that marsh, Duxbury Beach becomes an island with a height of about 3-5 feet above sea level before the storms hit it during full moon tides. Water pushes in on the narrow beach from both front and back. This island, again because of the marsh flooding, is about a mile out to sea.
- The roads in and out of Duxbury Beach wash over from the marsh well before high tide, with or without storms. If you're not out of Duxbury Beach by an hour before high tide, you're pretty much there for the day.
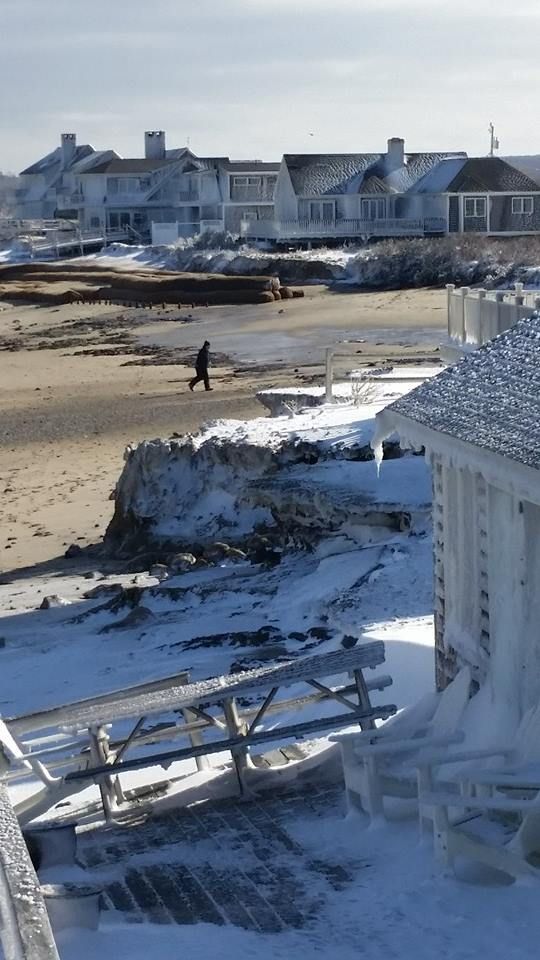
- Waves break on houses during storms, something you don't see (those shots of Scituate on the news are spray) a lot in non-hurricane communities.
- Duxbury is the first town on the South Shore (as well as the first town of the Big Three) to not enjoy protection from Cape Cod as a barrier beach. The wind seems to both sense and resent this status, and it hits Duxbury with monster truck force. This status is such that, if the wind is more southeast than east, the title shifts to Marshfield.
- Duxbury Beach has 6 miles of shoreline (plus, since she's a peninsula, 6 more of almost open-ocean bayside coast). About a third of a mile of that oceanfront has any sort of seawall in front of it. As we said, that seawall is about as low as they get on the South Shore, at least of the Army Corps Of Engineers variety. Even the section of the beach with the seawall gets catastrophic damage during storms. When you go beyond the seawall, it gets worse.
- Because of this tendency towards damage, they stopped trying to build any sort of cottages out there a long time ago. Duxbury Beach is prone to Galveston-style overwash in strong storms. Only a fool would build beyond the seawall.
- Because of that, Duxbury Beach has a limbo-under-a-schnauzer low population. I was one of four (4) kids in a 5 mile stretch of land when I was growing up there.
- That Peggotty Beach cottage (the one on stilts) picture I used for the Scituate section of this article? That house wouldn't be standing on Duxbury Beach. Duxbury lost their last no-seawall-in-front-of-them cottages in the Blizzard of '78, and they were already husks for decades by that point. Scituate, if you drive through it, is full of that 1950s cottage style that has long since been destroyed and rebuilt differently in Duxbury.
- This author puts Gurnet Point and Saquish into the Duxbury category, even though they are part of Plymouth. If you ever get a chance to view Gurnet Point, know that this terribly exposed area is actually the high ground on Duxbury Beach... and by a large margin. Saquish was most likely an island when the Pilgrims arrived.
- The reason you don't see Duxbury on the news during storms is because it is impossible to get a news van in and out of Duxbury Beach for a half dozen hours or so during a storm events. You almost have to wait for low tide to leave in some instances. A morning news crew sent to Duxbury Beach for a storm wouldn't get back to Boston until the evening news broadcast was happening.
- My brother used to manage Avalon, and we had a piece of Avalon's old dance floor in my Ocean Road North cellar prior to the Halloween Gale. It actually washed out of the house during the Gale, and we later found it 5 miles across Duxbury Bay, by Sweetser's.
- No one less than the National Guard will prevent you from entering Duxbury Beach during bad storms. They will also intercept, buy and eat any pizzas you try to get delivered into Duxbury Beach during a storm, as we found out during the Halloween Gale.

Anyhow, those are the rankings. Questions? Appreciation? Hate? Differing opinions? That's what the Comments feature is for. Use it.