Wednesday, February 10, 2016

Coastal Flooding In Green Harbor And Duxbury Beach

Waves breaking on houses, Ocean Road North, Duxbury...
We went off-Cape to see what sort of action that the South Shore was getting from Momma Ocean. A blizzard had just blown through town, and we were getting reports of wild surf on Duxbury Beach. We were on our way up the moment we got Logo on the bus (2 hour delay). We made it just in time for high tide.

Surf photography is often easier if you go the day after the storm. The storm is usually just offshore a bit, and it is slow-rolling waves back to the coast. Unlike waves on the day of the blizzard, you can go outside and shoot waves without getting soaked by rain or blown around by the wind.

The Great Salt Marsh, Duxbury
The plan was to go to Duxbury Beach, hook up with some friends, and watch the storm from their house. That plan came to a stop when we were unable to get down Gurnet Road.

Duxbury Beach often floods backwards, as in "via the marsh." This happens before high tide, which brings the waves and their splashover water into the mix as well.

We made it through the first puddle easily enough, but we saw an SUV struggling with the next puddle. We called "No Mas" like Roberto Duran.


We tried the Bay Street/Bay Avenue turn where Marshfield meets Duxbury Beach, that wasn't happening, either.

We were in a Dodge Stratus, and she sits about 4 inches from the ground. She is not built for plowing through street flooding, especially where it's 11 AM in Duxbury and we have to get a kid off the bus at 3:30 PM in Buzzards Bay. It's tough to keep that schedule with a dead car.

We took pictures of the flooded roads, and they came out so well that we decided to double up on flooded-marsh pictures.


We finally made it to the beach around where the Green Harbor General Store is. We didn't make it by much, as the bridge by the Green Harbor Lobster Pound was almost washed over... as you can tell.

We were running the risk of getting trapped, but I liked our chances of escaping.

This was my favorite jump-off bridge as a kid, although I think I'd break both legs if I even stepped off of it now.


I parked down where that SUV is in the upper right, and this gave me access to the Burke's Beach section of town for my camera work.

Burke's benefits from having a jetty, which keeps the water off the houses.

OK, it does so when it's above water.


Small print, kills you every time.

The risk was worth it, because I ended up being behind the waves that were breaking on the houses along Green Harbor and Duxbury's seawall. You can do that due to the wave-blocking presence of Brant Rock, and due to the curvature of the seawall.


I only got my feet wet, and that was because I let my attention wander.

This is bad, but not as bad as it looks. The spray is the water hitting the seawall. This throws up spray, which catches the wind and gives me cool shots.


Brant Rock got it as badly as Green Harbor did, if not worse. BR, remember, is the part of town that got beaten down last winter.

I would have headed over, but I didn't want to go through the Esplanade splashover puddle... which, the last time I checked, encompasses all of the BR business district.


These are good-sized waves for the Duxbury Beach/Green Harbor region.

I saw at least one scientist paper claiming that the maximum height that waves can reach on this strip goes around 5 feet, but I saw much bigger waves during the Halloween Gale and the Blizzard of 78.


My camera actually has color and everything, it just was a grey day.

These shots are mostly Green Harbor, but some Duxbury Beach can be seen on the left end of any given pic.

Not these ones below, I zoomed in on Vegas. Duxbury starts about where the giant break in the seawall is.. you know, the one you can't see in these pics.


"The impact will blow trees back and crack statues."

Thanks to our host for the day, Green Harbor!

.

Tuesday, February 9, 2016

Post-Super Bowl Blizzard Pics From Around Cranberry County

When in doubt, get behind the plow and never give up the spot.

Brant Rock, via Sara Flynn

More from Sara, of the Duxbury marsh, the Powder Point Bridge is obscured.

Road to Duxbury Beach blocked off.... (Sara again)

Snow trees in Bourne....

Minor-moderate coastal flooding, Duxbury Beach (via Libby Carr)...

Jack-knifed big rig on the Rte 25 on-ramp in Bourne (cleared as of 11:25, courtesy of the BPD)

There's a good 150-200 yards of visibility in Hyannis (via Scott Rodrigues)

Bourne, MA, this may be from Saturday's atmospheric entertainment....

The camera skills go downhill fast like Ramadan when I shiver....

A bit at a time, can't over-exert...

Sunday, February 7, 2016

Blizzard Warning For Barnstable, Plymouth Counties


SOUTHERN PLYMOUTH:

...BLIZZARD WARNING IN EFFECT FROM 4 AM TO 7 PM EST MONDAY...

THE NATIONAL WEATHER SERVICE IN TAUNTON HAS ISSUED A BLIZZARD
WARNING...WHICH IS IN EFFECT FROM 4 AM TO 7 PM EST MONDAY.

* LOCATIONS...SOUTHEAST MASSACHUSETTS INCLUDING CAPE COD AND THE
ISLANDS. THIS INCLUDES THE CITIES AND TOWNS OF BROCKTON...
PLYMOUTH...MATTAPOISETT...CHATHAM...FALMOUTH...PROVINCETOWN...
VINEYARD HAVEN AND NANTUCKET

* HAZARD TYPES...HEAVY WET SNOW AND STRONG WINDS MAY RESULT IN
DOWN TREE LIMBS AND POSSIBLE POWER OUTAGES. STRONG WINDS AND
HEAVY SNOW WILL CREATE BLIZZARD/WHITE-OUT CONDITIONS AT TIMES.

* ACCUMULATIONS...SNOW ACCUMULATION OF 8 TO 12 INCHES...BUT
POTENTIALLY UP TO 18 INCHES OVER PARTS OF PLYMOUTH COUNTY AND
UPPER CAPE COD. LESS SNOWFALL OF 4 TO 8 INCHES IS EXPECTED FOR
NANTUCKET.

* TIMING...SNOW OVERSPREADS THE AREA 5 AM TO 8 AM MONDAY MORNING
WITH THE HEAVIEST SNOW OCCURRING AFTER 8 AM AND INTO THE EARLY
AFTERNOON. SNOW INTENSITY WILL BEGIN TO DIMINISH BETWEEN 4 PM TO
7 PM.

* IMPACTS...CONSIDERABLE FALLING AND/OR BLOWING AND DRIFTING SNOW.
VISIBILITIES WILL BECOME POOR WITH WHITEOUT CONDITIONS AT TIMES.
THOSE VENTURING OUTDOORS MAY BECOME LOST OR DISORIENTED...SO
PERSONS IN THE WARNING AREA ARE ADVISED TO STAY INDOORS.

* WINDS...NORTHEAST 30 TO 40 MPH WITH GUSTS UP TO 65 MPH.

* VISIBILITIES...ONE QUARTER MILE OR LESS AT TIMES.


PRECAUTIONARY/PREPAREDNESS ACTIONS...

A BLIZZARD WARNING IS ISSUED WHEN SUSTAINED WINDS OR FREQUENT
GUSTS OVER 35 MPH ARE EXPECTED WITH CONSIDERABLE FALLING AND/OR
BLOWING AND DRIFTING SNOW. VISIBILITIES WILL BECOME POOR WITH
WHITEOUT CONDITIONS AT TIMES. THOSE VENTURING OUTDOORS MAY
BECOME LOST OR DISORIENTED...SO PERSONS IN THE WARNING AREA ARE
ADVISED TO STAY INDOORS.


...COASTAL FLOOD WARNING IN EFFECT FROM 9 AM TO 1 PM EST MONDAY...

THE NATIONAL WEATHER SERVICE IN TAUNTON HAS ISSUED A COASTAL FLOOD WARNING...
WHICH IS IN EFFECT FROM 9 AM TO 1 PM EST MONDAY. THE COASTAL FLOOD WATCH IS NO
LONGER IN EFFECT.

* LOCATION...EASTERN MASSACHUSETTS COASTLINE FROM PLYMOUTH COUNTY SOUTH
THROUGH CAPE COD INCLUDING NANTUCKET.

* COASTAL FLOODING...AREAS OF MODERATE COASTAL FLOODING ARE
EXPECTED.

* TIMING...THE LATE MONDAY MORNING TO MIDDAY HIGH TIDE CYCLE...
SPECIFICALLY 9 AM TO 1 PM.

* IMPACTS...MODERATE COASTAL FLOODING PRODUCES WIDESPREAD
FLOODING OF VULNERABLE SHORE ROADS AND/OR BASEMENTS DUE TO THE
HEIGHT OF STORM TIDE AND/OR WAVE ACTION. NUMEROUS ROAD CLOSURES
MAY BE NEEDED. LIVES MAY BE AT RISK FOR PEOPLE WHO PUT
THEMSELVES IN HARMS WAY. ISOLATED STRUCTURAL DAMAGE MAY BE
OBSERVED.


PRECAUTIONARY/PREPAREDNESS ACTIONS...

A COASTAL FLOOD WARNING MEANS THAT MODERATE OR MAJOR COASTAL
FLOODING IS EXPECTED. MODERATE COASTAL FLOODING PRODUCES
WIDESPREAD FLOODING OF VULNERABLE SHORE ROADS AND/OR BASEMENTS DUE
TO THE HEIGHT OF STORM TIDE AND/OR WAVE ACTION. NUMEROUS ROAD
CLOSURES MAY BE NEEDED. LIVES MAY BE AT RISK FOR PEOPLE WHO PUT
THEMSELVES IN HARMS WAY. ISOLATED STRUCTURAL DAMAGE MAY BE
OBSERVED.

&&

NOCERA/CADIMA

&&

&&

ALL TIDE HEIGHTS ARE RELATIVE TO MEAN LOWER LOW WATER.
TIME OF HIGH TOTAL TIDES ARE APPROXIMATE TO THE NEAREST HOUR.

SCITUATE

TOTAL
TIDE DAY/TIME SURGE WAVES FLOOD
/FT/ /FT/ /FT/ CATEGORY
----------- ---------- --------- ------- ----------
8.8- 9.3 07/11 PM -0.2/ 0.2 2-8 NONE
12.1-12.6 08/11 AM 1.7/ 2.2 12-14 MINOR-MDT
11.1-11.6 08/11 PM 1.6/ 2.0 11-14 MINOR
10.9-11.4 09/12 PM 0.2/ 0.7 7-8 NONE
10.2-10.7 10/12 AM 0.2/ 0.8 5-6 NONE
10.8-11.3 10/12 PM -0.2/ 0.3 4-5 NONE

SANDWICH / DENNIS

TOTAL
TIDE DAY/TIME SURGE WAVES FLOOD
/FT/ /FT/ /FT/ CATEGORY
----------- ---------- --------- ------- ----------
8.9- 9.4 07/11 PM 0.0/ 0.5 1-6 NONE
12.4-12.9 08/11 AM 2.2/ 2.7 8-11 MINOR
11.2-11.7 08/11 PM 1.9/ 2.3 6-10 NONE
11.0-11.5 09/11 AM 0.5/ 1.0 3-4 NONE
10.2-10.7 10/12 AM 0.5/ 1.0 2 NONE
10.6-11.1 10/12 PM 0.0/ 0.5 1-2 NONE

PROVINCETOWN HARBOR

TOTAL
TIDE DAY/TIME SURGE WAVES FLOOD
/FT/ /FT/ /FT/ CATEGORY
----------- ---------- --------- ------- ----------
9.3- 9.8 07/11 PM -0.2/ 0.2 1-2 NONE
12.6-13.1 08/11 AM 1.7/ 2.2 2 MINOR-MDT
11.8-12.3 08/11 PM 1.8/ 2.2 1 NONE
11.5-12.0 09/12 PM 0.2/ 0.8 4 NONE
10.8-11.3 10/12 AM 0.4/ 0.9 3 NONE
11.3-11.8 10/12 PM 0.0/ 0.5 2-3 NONE

CHATHAM - EAST COAST

TOTAL
TIDE DAY/TIME SURGE WAVES FLOOD
/FT/ /FT/ /FT/ CATEGORY
----------- ---------- --------- ------- ----------
5.5- 6.0 07/11 PM -0.2/ 0.3 3-8 NONE
8.8- 9.3 08/11 AM 1.9/ 2.3 14-17 MINOR
7.5- 8.0 09/12 AM 1.6/ 2.0 12-15 NONE
7.3- 7.8 09/12 PM 0.2/ 0.8 7-8 NONE
6.7- 7.2 10/01 AM 0.4/ 0.9 6 NONE

CHATHAM - SOUTH COAST

TOTAL
TIDE DAY/TIME SURGE WAVES FLOOD
/FT/ /FT/ /FT/ CATEGORY
----------- ---------- --------- ------- ----------
3.2- 3.7 07/11 PM -0.3/ 0.2 1-2 NONE
5.9- 6.4 08/11 AM 1.3/ 1.8 3-4 NONE
5.2- 5.7 09/12 AM 1.5/ 2.0 2-3 NONE
5.0- 5.5 09/12 PM 0.2/ 0.8 3-4 NONE
4.4- 4.9 10/01 AM 0.4/ 0.9 3 NONE

BUZZARDS BAY - WOODS HOLE

TOTAL
TIDE DAY/TIME SURGE WAVES FLOOD
/FT/ /FT/ /FT/ CATEGORY
----------- ---------- --------- ------- ----------
1.3- 1.8 07/07 PM -0.7/-0.2 1 NONE
3.6- 4.1 08/08 AM 1.1/ 1.6 2 NONE
3.2- 3.7 08/08 PM 1.2/ 1.7 2-3 NONE
3.5- 4.0 09/09 AM 1.0/ 1.5 1-2 NONE
2.7- 3.2 09/09 PM 0.6/ 1.1 1 NONE
2.5- 3.0 10/09 AM 0.0/ 0.5 1-2 NONE

WINGS NECK

TOTAL
TIDE DAY/TIME SURGE WAVES FLOOD
/FT/ /FT/ /FT/ CATEGORY
----------- ---------- --------- ------- ----------
3.2- 3.7 07/08 PM -0.7/-0.2 1 NONE
5.1- 5.6 08/09 AM 0.4/ 0.9 1 NONE
5.0- 5.5 08/09 PM 0.9/ 1.4 1 NONE
5.9- 6.4 09/09 AM 1.1/ 1.6 1 NONE
4.9- 5.4 09/10 PM 0.5/ 1.0 1 NONE
4.7- 5.2 10/10 AM 0.0/ 0.5 1 NONE

NANTUCKET HARBOR

TOTAL
TIDE DAY/TIME SURGE WAVES FLOOD
/FT/ /FT/ /FT/ CATEGORY
----------- ---------- --------- ------- ----------
2.7- 3.2 07/11 PM -0.2/ 0.2 2-5 NONE
5.6- 6.1 08/12 PM 2.0/ 2.5 7-8 MODERATE
4.7- 5.2 09/12 AM 1.6/ 2.0 4-6 MINOR
4.0- 4.5 09/12 PM 0.4/ 0.9 3 NONE
3.6- 4.1 10/01 AM 0.2/ 0.8 3 NONE

NANTUCKET EAST COAST - EROSION IMPACTS

TOTAL
TIDE DAY/TIME SURGE WAVES FLOOD
/FT/ /FT/ /FT/ CATEGORY
----------- ---------- --------- ------- ----------
3.1- 3.6 07/11 PM 0.0/ 0.5 3-7 NONE
5.9- 6.4 08/11 AM 2.2/ 2.7 10-11 MINOR-MDT
5.0- 5.5 09/12 AM 1.7/ 2.2 9-10 NONE
4.0- 4.5 09/12 PM 0.4/ 0.9 7 NONE
3.7- 4.2 10/01 AM 0.4/ 0.9 6-7 NONE

NANTUCKET - MADAKET AREA EROSION IMPACTS

TOTAL
TIDE DAY/TIME SURGE WAVES FLOOD
/FT/ /FT/ /FT/ CATEGORY
----------- ---------- --------- ------- ----------
2.0- 2.5 07/11 PM -0.3/ 0.2 2-4 NONE
4.0- 4.5 08/11 AM 1.3/ 1.8 5-6 NONE
4.2- 4.7 09/12 AM 1.7/ 2.2 5-6 NONE
3.2- 3.7 09/12 PM 0.4/ 0.9 4 NONE
2.8- 3.4 10/01 AM 0.2/ 0.8 4-5 NONE

February snow...


Thursday, February 4, 2016

February Snow


I think that even the wimpiest of us would agree that we have had a mild winter so far. That may or may not change in the coming weeks, but that's not what we're here to discuss today.

We're at roughly what I consider to be mid-winter. I may not be correct officially or technically, but it's a good working model. A little bit of November, all of December, January, February and March, plus a bit of April... early February is smack dab in the middle of that.

With that in mind, let's sort through some weather facts and speculation that may get you some proper mojo for those times when you ponder the weather at great lengths.

There will be a bit of a Boston focus, as I have a lot of Boston weather data handy. Your town may be different, but it's good enough to work with. I'm leaning heavily on a Weather Channel page. I refuse to use Winter Storm Names.

- Some of our worst storms, like the Blizzard of '78, came in the shortest month of he year.

-Top Boston Snowstorms
1. Feb. 17-18, 2003: 27.6 inches
2. Feb. 6-7, 1978: 27.1 inches
3. Feb. 24-26, 1969: 25.8 inches
4. Mar. 31 - Apr. 1, 1997: 25.4 inches
5. Feb. 8-9, 2013: 24.9 inches
6. Jan. 26-28, 2015: 24.6 inches
7. Feb. 7-10, 2015: 23.8 inches
8. Jan. 22-23, 2005: 22.5 inches
9. Jan. 20-21, 1978: 21.4 inches
10. Mar. 3-5, 1960: 19.8 inches

- Three of Boston's five snowiest months (including #1 overall, with a bullet) were, as you'll see, various forms of February.

- People looking at Top Boston Snowstorms charts in the future will be like, "Damn, it must have sucked in 2015 to get 24.6 inches of snow on January 28th and then get 23.8" on February 7th," and they could quite possibly be completely unaware that there was also a Groundhog Day blizzard in 2015 that did like 18". We just fail to mention it, because History of any sort is full of these little nuances.

- Top Snowfall Totals For A Month in Boston, and remember that you lose about 10% of the calendar with February:
1. February 2015: 64.8 inches
2. January 2005: 43.3 inches
3. January 1945: 42.3 inches
4. February 2003: 41.6 inches
5. February 1969: 41.3 inches

- It's odd that December or March didn't force their way in the mix up there in that list. I suppose that Spring is asserting herself by March, and that the ground is too warm in December.

- April, which has had some heavy blizzard-type snowfalls, just doesn't get enough follow-up events to break into that very close (one inch of snow stands between the second worst month of snow ever and the fifth worst) pile of months that make up rankings-2-5.

- March had a 19.8 inch head-start in 1960 and failed to get near the top 5. April had about 24" by April 1st of 1997, but couldn't generate enough powda to be a true player.

- Barnstable, which is in the middle of Cape Cod and gets Gulf Stream water, has had a worse winter so far than more-northern Boston has chalked up. Boston has had 10" of snow this winter, while parts of Cape Cod took in 15" of snow from just that last storm.

- Boston does about 43.6" of snow per winter. I think that Barnstable clocks 25" or so per winter.

- Boston's 10 Worst Winters:
1. 2014-2015: 110.6 inches
2. 1995-1996: 107.6 inches
3. 1993-1994: 96.3 inches
4. 1947-1948: 89.2 inches
5. 2004-2005: 86.6 inches
6. 1977-1978: 85.1 inches
7. 1992-1993: 83.9 inches
8. 2010-2011: 81.0 inches
9. 1915-1916: 79.2 inches
10. 1919-1920: 73.4 inches

- Notice that nearly 2 feet of snow stand between #2 and #5 on this list, while 1 inch stands between #2 and #5 in snowiest months. Those were some genuinely awful winters.

- Boston got 94.4 inches of snow in the thirty days between January 24th and February 22nd, 2015. It would be the third snowiest winter overall, just those 30 days.

- Any kid about 25 years old or so who has lived here all of his life can hold his own with any old-timer, no matter how salty he may be, in a discussion about difficult Boston winters. Even a 105 year old man will have only seen three other winters that would place in the top ten.

- A 128 year old man would have seen the Blizzard of 1888, albeit as a child. However, at that point, the 128 year old man would be more interesting than Blizzard of 1888 discussion.

- Old folks would have recourse against whippersnappers in things like Ice Storms and Really, Really Cold Weather. It generally goes without saying that this current generation has better plowing and forecasting. It also generally goes without saying that old people have a better feel for the weather, and always will.

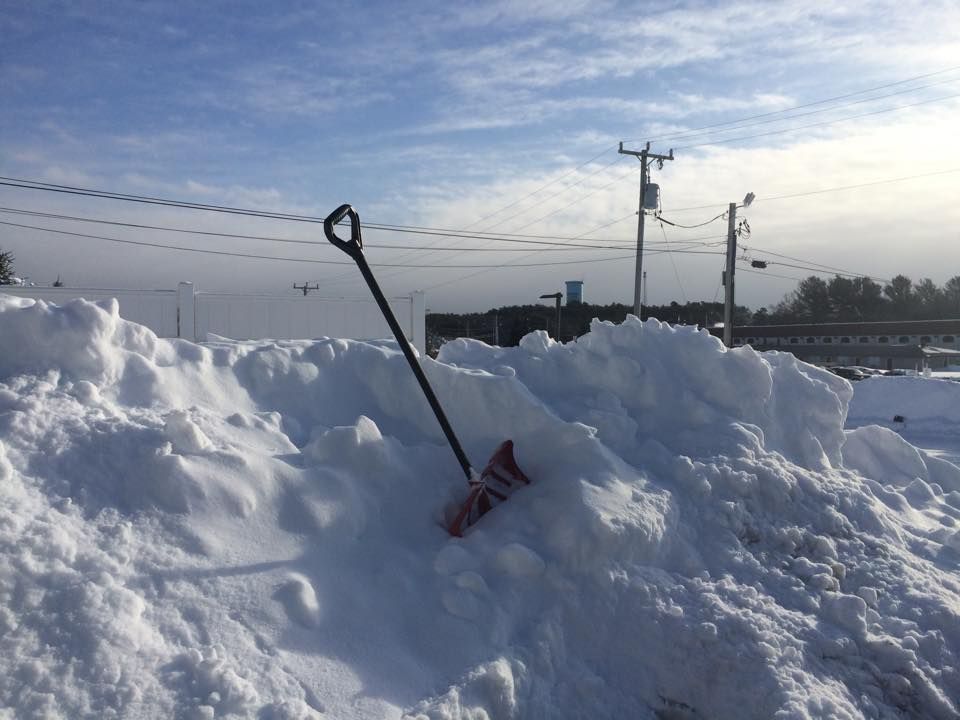
- In 2015, Boston had a Boston-record 37" snow pack. We had 6 feet of snow fall between January 24th and February 10th, and 90" between 1/24 and 2/15. We had 4 days where we had at least 12 inches of snow (a record shared with 1978 and 1960-61). Boston had 6 days in a row with at least a half-inch of snow. They also had 28 straight days where the temperature didn't get above 20.

- Some perspective:

Heaviest One-Day Snowfall (inches and centimeters)
Georgetown, Colorado 63 160 Dec 4 1913
Thompson Pass, Alaska 62 157 Dec 29 1955
Giant Forest, California 60 152 Jan 19 1933
Mount Washington, NH 49 125 Feb 25 1969
Millegan, Montana 48 122 Dec 27 2003
Gunn's Ranch, Washington 48 122 Jan 21 1935
Deadwood, South Dakota 47 119 Mar 14 1973
Watertown, New York 45 114 Nov 15 1900
Heber Ranger Station, Arizona 38 97 Dec 14 1967
Morgantown, Pennsylvania 38 97 Mar 20 1958
Wolf Ridge, Minnesota 36 91 Jan 7 1994

Snowiest Average Winters, (inches and centimeters)
Mt Rainier, Washington 671 1704
Alta, Utah 546 1387
Crater Lake Park, Oregon 483 1226
Brighton, Utah 411 1044
Echo Summit, California 407 1035

Most Days With Snowfall 
Mt Rainier, Paradise Station, Washington 121.4
Mt Washington, New Hampshire 118.5
Climax Mine, Colorado 104.4
Crater Lake Park Headquarters, Oregon 101.3
Shemya Island, Alaska 98.3
Yellowstone Park South Entrance, Wyoming 94.5

Snowiest Large US Cities, Average Year, (inches and centimeters)
Rochester, New York 99.5 252.7
Buffalo, New York 94.7 240.5
Cleveland, Ohio 68.1 173.0
Salt Lake City, Utah 56.2 142.7
Minneapolis, Minnesota 54.0 137.2
Denver, Colorado 53.8 136.7
Milwaukee, Wisconsin 46.9 119.1
Boston, Massachusetts 43.8 111.3
Detroit, Michigan 42.7 108.5
Pittsburgh, Pennsylvania 41.9 106.4
Hartford, Connecticut 40.5 102.9
Chicago, Illinois 36.7 93.2
Providence, Rhode Island 33.8 85.9
Columbus, Ohio 27.5 69.9
Indianapolis, Indiana 25.9 65.8
New York, New York 25.1 63.8

- Boston, and Massachusetts in general, rules 'Merica in one weather-related category... Wind Speed. Boston has an average wind speed of 12.4 mph. Massachusetts owns 4 of the top 5 spots when ranked among cities with more than 50,000 people. Weymouh, Brockton, Framingham, Newton, Peabody, Waltham, Quincy, Lowell, Brookline, and Lynn are all in the top 20.

Windiest US Cities (>50,000 people)
1. Weymouth Town, MA (housing) (pop. 55,419) 14.7 mph
2. Brockton, MA (housing) (pop. 94,089) 14.3 mph
3. Framingham, MA (housing) (pop. 68,318) 13.6 mph
4. Amarillo, TX (housing) (pop. 196,429) 13.3 mph
5. Weymouth, MA (housing) (pop. 54,393) 13.2 mph
6. Cheyenne, WY (housing) (pop. 62,448) 12.9 mph
7. Fort Collins, CO (housing) (pop. 152,061) 12.8 mph
8. Newton, MA (housing) (pop. 87,971) 12.7 mph
9. Casper, WY (housing) (pop. 59,628) 12.7 mph
10. Waltham, MA (housing) (pop. 62,227) 12.6 mph
11. Loveland, CO (housing) (pop. 71,334) 12.6 mph
12. Quincy, MA (housing) (pop. 93,494) 12.5 mph
13. Greeley, CO (housing) (pop. 96,539) 12.5 mph
14. Rochester, MN (housing) (pop. 110,742) 12.5 mph
15. Great Falls, MT (housing) (pop. 59,351) 12.5 mph
16. Peabody, MA (housing) (pop. 52,044) 12.5 mph
17. Brookline, MA (housing) (pop. 58,732) 12.5 mph
18. Lowell, MA (housing) (pop. 108,861) 12.5 mph
19. Lubbock, TX (housing) (pop. 239,538) 12.4 mph
20. Lynn, MA (housing) (pop. 91,589) 12.4 mph
21. Boston, MA (housing) (pop. 645,966) 12.4 mph

- Viewed in the Year Without A Sana Claus weather logic that I use in lieu of any formal meteorological training, New England is often brought up in arguments where people propose that there are actually several Misers involved in our weather. You could make a case for Warm Miser, Mild Miser and/or Seasonably Cold Miser.

It my be a case where Heat Miser and Cold Miser are General Grant and General Lee, and Seasonably Cold Miser is a subordinate, Jubal Early-style figure.


Sunday, January 31, 2016

Snowstorm Intensity Scale


Americans have become accustomed to having their storm information categorized to some extent. It's very handy. If you fear cyclones, don't buy a house in Tornado Alley. If you love snow, don't move to the Sun Belt. Don't sucker-punch anyone from Marblehead, don't eat at the E-Coli Deli, and don't swim in Hungry Crocodile Lake.

With just a few moments of study, you can even get a relative view of any large storm that hit your area. The storm that ruined your picnic might not seem so bad if you became aware of what storms have done to places like Gavelston, TX or Xenia, OH.

If you know the wind speed of the hurricane or tornado that hits your town, you can easily grade it along the lines of the rubric provided by the Saffir-Simpson hurricane wind scale or the Fujita tornado intensity scale.

Those may not be household names, but you are most likely familiar with the terms associated with them. Saffir-Simpson is where we get the "Category 1 Hurricane" ranking from, and Fujita is where you get the "F-5" tornado" classification from. Cali has the earthquakian Richter Scale.

New England sort of ranks poorly with these rubrics. We get very few tornadoes when compared to, say, Kansas. That's why Dorothy was a farm girl instead of a lobsterman's daughter. Although we are nautical and have a hurricane scored in the higher percentile of the rankings, Florida has several storms ranked ahead of the worst storm Massachusetts ever got hit by. I'm pretty sure that a California wildfire doesn't even get on the news until it burns an area the size of Plymouth County.

They won't do it when we're watching, but you get a sense that other states might talk about us being Weather Wimps.

We do have one area that we rule, albeit as a small part of a sprawling Meglopolis. The NESIS (North East Snowfall Impact Scale) is a ranking system designed for high-impact snow events. Other regions have similar scales, but the population of the Northeast generally wins us the title.

It uses a complicated rubric that, if I am simplifying it properly, takes Snowfall Total, Area Of Snowfall, and Population Impacted By The Event and works a score from them.


It's a tricky scale. For starters, I don't even know how to read that Good Will Hunting math that they're using.

(Readers should know that I took only one math class during my college days... Prob and Stat. I scored an A on my first quiz, then a B, then a C, then a D, then a series of Fs. I never missed a class, always took part in the lessons, and did my homework, so I was hanging around C- when the final exam was scheduled. I'm just not that smart, especially if you don't count Creativity as a form of Intelligence.

On the day of the final exam, a man was maimed at the factory I was working at to put myself through college. It sort of fell on me to save the man's life. OSHA sent a shrink down to counsel the people who witnessed the bloody accident. When I told her that I had a Stat final in a few hours, she wrote a very good note for my professor.

When I gave the note to the Professor, he looked at it, looked at me (I went to the class right from the factory, and still had blood on me), looked at his grade book, and asked me "Are you planning on working for NASA or anything brainy like that?" When I told him I wasn't, he opened his wallet, gave me $10, and said "Go home, get a six pack, don't worry about the test,  you'll get a B for the term."

Anyhow, that's why I don't know what that E thing in the math equation is. I think it means Epsilon, and has something to do with fraternities.)


Minnesota (once you get away from Lake Superior's moderating effect) has far snowier winters than we do. Boston complained for 3 months about a winter that barely gave us 100 inches of snow. Minnesota has had 170 inches of snow fall on it in a winter.

You'd think that Minnesota would score wildly on NESIS... but nobody lives in Minnesota. OK, about five million people live there, so "nobody" might be unfair. However, the Greater Boston Metropolitan Area also has about 5 million people, and you could fit 50 Greater Bostons into Minnesota's land area.

So, Minnesota wastes a 40 inch snowstorm on a few thousand people who were already isolated before the storm. Boston, however, gets maximum misery out of every snowflake.

When I look at NESIS, the sportswriter in me immediately thinks "Quarterback Ratings." Saffir-Simpson is like the Home Run leader in baseball. Babe Ruth hit 714 home runs. That means that he hit 714 balls that either left the park or caused such confusion staying in the park that Babe was able to cover 4 bases with that 1920s newsreel speed-waddling he used. Saffir-Simpson is easy like that.

Fujita is the same. Got the wind speed? Look at the Fujita chart. There's your answer. No math, as Roberto Duran once didn't say.

NESIS is like the QB ratings in the NFL. I was one of AOL's main football writers for several years, and I have no idea how they figure out QB rankings. There's an answer somewhere, but I'm not interested in anything that ends in 158.3. If you're arguing Quarterback Merit in a bar and you say "So and So has a 137.6 rating, while your guy only has 121.9," the answer you get should be a big fist slamming into your nose.

Rather than coming up with some fancy term like "Category 3 hurricane" or F-4 Tornado," they have 5 grades:

Notable

Significant

Major

Crippling

Extreme

There are some flaws to NESIS.

Wind Speed doesn't seem to be a factor, nor does Coastal Flooding. Everyone in Massachusetts remembers the Blizzard of '78, but fewer people remember the storm a few weeks before the Blizz which dropped 10-20" from Maine to West Virginia. The Blizzard, which was a far more devastating storm that touched a smaller land area, ranks lower than her January of '78 sister storm.

The list seems to have some notable exclusions. I don't see any Winter 2015 action there, although I may have an old article I'm using for my stats (Ed. note: his list is from 2010). March of 1993 was the worst storm they ranked, but we got a measly 10 inches out of that one, as the heavy snowfall fell elsewhere.

New England also loses out on this list a lot because some of our more notable storms are either nor'easters which form just off of our shores and drop White on only us, or they are storms which pass out to sea by most of the US before clipping us. Some large snowfalls that only hit Cape Cod would fail to make the list over Population reasons, even if they were worse storms than milder ones which hit a lot of people.

NESIS also sounds like the acronym for a bunch of Muslims that Donald Trump wants to kill, but we're starting to drift away from the Science.

Some of the top snowstorms in US history that touched Eastern Massachusetts:

March 1956, late season storm does 10-20" in MA, NYC and Long Island
February 1958, 10-20" for all of New England, snow in Alabama, Georgia and Mississippi
December 1960, 10-20" from Maine to the Old Dominion
March 1960, 20-30" for all of Massachusetts east of Worcester, including the Cape.
February 1961, 10-20" in MA, 3 feet in upstate NY
January 1964, a Category 4 ("Crippling") does 10-20" in MA
January 1966, I think Buffalo got buried by previously-fallen snow blowing off a frozen Lake Erie.
February 1967, 10-20" snow hit New England with monster-truck force.
February (8-9) 1969, 20" across Massachusetts, even NYC... had a worse storm 2 weeks later.
February (22-29) 1969, 3 feet in all of Maine and NH, 20" all over MA
January 1978, 20+", This snow was still on the ground when the Blizzard of '78 hit.
February 1978, speaking of the Blizzard....
April (6-7), 1982, late season storm, 10-20" west of 495
February 1983, I-95 special
January 1987, Cape Cod is the northern fringe of a storm that made it snow in both Carolinas.
March 1993, Cat. 5 (Extreme), 30" from Vermont to Tennessee, the highest ranked NESIS storm
February 1994, 20-30" of snow hitting the Cape, the South Coast and South Shore
January 1996, #2 on the list as of 2010
April 1997, the April Fool's Day Blizzard
February 2003, 10-20" in Plymouth County
January 2005, 3 feet of snow in EMass, the most snow I've personally seen fall.
February 2007, snow from MA to Texas
February 2010, snowstorm touches 20+ states, one of three Major storms in a month
February 2013, The start of our current run.
January-March, 2015... I sort of count it as one big Event.
January 2016, a Cat. 4 (Crippling), set NYC's all-time record, 10-15" on Cape Cod

Notes:

- There wasn't an impact storm 9 months before my birthday, nor Jessica's.

- I do not believe that the list goes back before 1956, most likely due to population growth with the Baby Boom. The Blizzard of 1888 would have topped this list if it hit when NYC had 10 million people.

- Eastern Massachusetts gets little lulls, like the early 1970s, most of the 1980s, and the early-mid 1990s. We've been getting fairly regular impact events since 2003 or so.

- I assume that these lulls were periods where the Heat Miser was winning his mano y mano with the the Cold Miser. Southeastern Massachusetts, and especially Cape Cod, is sort of a buffer zone between the two rivals... sort of a Boston accented Latvia. The Cold Miser has been dominating lately.

- February of 1969 and January-February 1978 rivaled the January-March 2015 snow blitz for a few storms, but the winters then ran out of gas. 2015 had staying power.

- I can dig up info on the post-2010 storms, perhaps even rank them, but they won't have handy maps.

- The two worst NESIS-ranked storms up until 2010 (1993 and 1996) just grazed us, relatively. March 1960 is the highest Eastern Mass ranks on this NESIS list.